

U.S. Wire Rod Final Imports
Wire rod final imports to the U.S. were up 3.8% year to date (YTD), year on year (y/y), totaling 1,680,599 tons for the ten months ending October 2017. October’s tonnage recorded 148,477 tons, 11.4% lower than the YTD average volume of 168,070 tons.
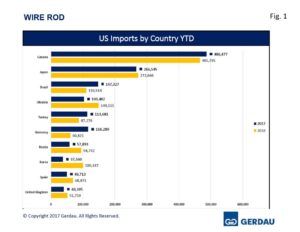 Figure 1 charts the largest exporting countries in rank order on a YTD basis through October for both 2016 and 2017. Canada was the largest exporter with 486,477 tons, up 4.4% YTD y/y. October’s tonnage was 50,216 tons, 3.2% greater than its YTD average of 48,648 tons. Japan sent 266,545 tons to the U.S. YTD, down 2.2% YTD y/y. October’s volume came in at 27,063 tons, 1.5% more than its YTD average of 26,655 tons. Brazil exported 147,327 tons of rod, gaining 33.3% YTD y/y. October’s volume was 12,513 tons, 15.1% less than its YTD average volume of 14,733 tons. Germany was the next largest with 116,280 tons, up 91.2% YTD y/y. Volume for the month of October was 14,520 tons, 24.9% more than its YTD average of 11,628 tons. Turkey ranked fifth YTD with 113,681 tons, surging 30.3% YTD y/y. Turkey exported zero tons in October. September shipments were 714 tons, the only exports of rod in the past four months. Ukraine sent 103,482 tons of rod to the U.S., down 30.6% YTD y/y. Its shipment volumes have been erratic ranging from zero tons shipped in June, August September and October to 30,825 tons in February. Canada, Japan, Brazil, Germany, Turkey and Ukraine combined to account for 1,233,792 tons for 73.4% of total wire rod imports.
Russia brought in 57,893 tons wire rod to the U.S. YTD, 38.9% less than the same timeframe last year. Russia has not exported any rod in since August. Spain’s YTD y/y volume decreased by 27.8% to 49,713 tons. October tons fell to zero after just 45 in September, well below its YTD average of 4,971 tons. Egypt is a new entrant over the last four months adding to 48,699 tons YTD. October volume was 10,530 tons. Egypt did not ship any tons in 2016. Mexico YTD wire rod exports were 42,140 tons, off 12.5% YTD y/y. Mexico exported 1,375 tons of rod to the U.S. in October, down 67.4% from its YTD average of 4,214 tons.
The United Kingdom sent 40,305, down 22.1%, YTD y/y. The United Kingdom’s October volume was 4,045 tons, very close to its YTD average of 4,031 tons. Korea sent 40,305 tons of rod to the U.S. YTD, down 62.5% y/y. Korea’s October tons came-in at 704 tons, down 81.3% from its YTD average of 3,756 tons. South Africa exported 31,156 tons of rod to the U.S. market YTD, up 41.3% y/y. South Africa has not exported any rod since June. Italy exported 29,887 tons YTD, up 22.0% y/y. Italy did not send any rod to the U.S. in either September or October. Vietnam was back in the rod export market in October shipping 13,264 tons to the U.S. Its YTD total was 29,155 tons. Vietnam has only been active in April (54 tons) and August (15,838 tons) prior to October. Vietnam did not export rod to the U.S. in 2016. Belarus landed 27,757 tons of rod in the U.S. market YTD, down 21.5% y/y. Belarus has not shipped any tons since June.
Fourteen other countries exported a combined total of 52,541 tons, 3.1% of wire rod to the U.S. market YTD 2017. During the same period last year the same 14 country’s shipped substantially less, 4,657 tons.
New Orleans was the largest receiving port, offloading 531,262 tons YTD, off 0.3%, YTD y/y. New Orleans’ October volume was 33,471 tons. Detroit held the number two spot with 357,323 tons, up 7.9%, YTD y/y. Detroit received 39,058 tons in October. Ogdensburg, NY took-in 111,352 tons, down 6.3% YTD y/y. Its October receipts were for 10,675 tons. Houston-Galveston took-in 103,340 tons, up 15.5 %, YTD y/y. October’s tonnage was 17,961.
Tampa ranked fifth with 96,599 tons, off 12.6%, YTD y/y. Charleston received 90,713 tons, off 7.3%, YTD y/y. Philadelphia brought-in 82,370 tons, down 2.1%, YTD y/y. Mobile took-in 72,963 tons YTD, up 122%, YTD y/y. Savannah offloaded 62,776 tons, up 2.4%, YTD y/y. The 10th largest wire rod receiving port was Laredo TX, with 30,170 tons, down by 1.7% YTD y/y.
Nineteen additional ports combined to receive 141,731 tons of wire rod imports thus far in 2017, 8.4% of the total volume YTD. Year to date 2016, the same 19 ports took in 96,134 tons resulting in 5.9% of 2016 YTD shipments.
At Gerdau we closely follow trade in long products steel since it has a profound impact on domestic market share and material pricing. We want you, our valued customers to have access to current information that can help you better plan and operate your businesses.