

U.S. Wire Rod Final Imports
Wire rod final imports to the U.S. were up 9.6% year to date (YTD), year on year (y/y), totaling 1,414,511 tons for the eight months ending August 2017. August’s tonnage recorded 151,916 tons, 14.1% lower than the YTD average volume of 176,814 tons
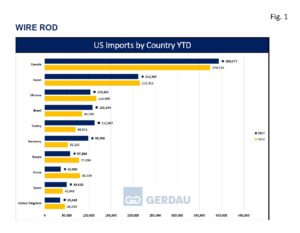 Figure 1 charts the largest exporting countries in rank order on a YTD basis through August for both 2016 and 2017.
Canada was the largest exporter with 393,977 tons, up 5.1% YTD y/y. August’s tonnage was 50,571 tons, 2.7% greater than its YTD average of 49,247 tons. Japan sent 211,969 tons to the U.S. YTD, down 1.6% YTD y/y. August’s volume came in at 30,221 tons, 14.1% more than its YTD average of 26,496 tons. Turkey ranked third YTD with 112,967 tons, surging 61.5% YTD y/y. Turkey did not export any rod in either July or August. Its YTD average was 14,121 tons. Brazil exported 108,244 tons of rod, gaining 27.7% YTD y/y. August’s volume was 8,778 tons, 35.1% lower than its YTD average volume of 13,531 tons. Ukraine sent 103,482 tons of wire rod to the U.S., down 11.5% YTD y/y. Its shipment volumes have been erratic ranging from zero tons shipped in June to 30,825 tons in February. Ukraine did not export any tons in August. Its YTD average was 12,935 tons. Canada, Japan, Turkey Brazil and Ukraine combined to account for 930,639 tons for 65.7% of total wire rod imports.
Germany was the next largest with 98,598 tons, up 88.6% YTD y/y. Volume for the month of August was 11,259 tons, 8.6% lower than its YTD average of 12,324 tons. Russia brought in 57,893 tons wire rod to the U.S. YTD, 24.4% less than for the same timeframe last year. Russia did not export any rod in August, its YTD average was 7,237 tons. Spain’s YTD y/y volume increased by 22.2% to 49,668 tons. August tons were 3,862, 37.8% lower than its YTD average of 6,209 tons. Mexico YTD wire rod exports were 39,769 tons, up 6.6% YTD y/y. Mexico exported 2,620 tons in August, down 47.3% from its YTD average of 4,971 tons. Korea sent 36,500 tons of rod to the U.S. YTD, off 53.5% y/y. Korea’s August tons totaled 9,126, double its YTD average of 4,563 tons.
The United Kingdom sent 35,449, down 23.2%, YTD y/y. The UKs August volume came-in at 4,333 tons, flat with its YTD average. South Africa exported 31,156 tons of rod to the U.S. market YTD. South Africa did not export any tons in July or August vs. its YTD average of 3,895 tons. Italy exporter 29,887 tons YTD, up 95.4% y/y. Italy’s August exports were just 6 tons YTD 2016. Italy’s rod exports have been very erratic ranging from zero tons in February and May to 16,762 tons in July. Its YTD average was 3,736 tons. Egypt is a new entrant with 16,762 tons in July followed by 11,561 tons in August. Egypt did not ship any tons in 2016. Belarus landed 27,757 tons of rod in the U.S. market YTD, down 21.5% y/y. Belarus has not shipped any tons since June.
Thirteen other countries exported a combined total of 48,610 tons, 3.4% of wire rod to the US market YTD 2017. During the same period last year the same 13 country’s shipped only 4,267 tons.
New Orleans was the largest receiving port, offloading 473,453 tons YTD, up 15.7%, YTD y/y. Detroit held the number two spot with 287,071 tons, up 8.6%, YTD y/y. Tampa ranked third with 85,470 tons, off 3.4%, YTD y/y. Houston-Galveston took-in 84,641 tons, up 33.8 %, YTD y/y. Philadelphia brought-in 69,083 tons, down 0.5%, YTD y/y. Charleston received 66,571 tons, off 25.8%, YTD y/y. Mobile took-in 53,906 tons YTD, up 64.2%, YTD y/y. Savannah offloaded 50,044 tons, down 3.5%, YTD y/y. The 10th largest wire rod receiving port was Laredo TX, with 29,572 tons, higher by 35.7% YTD y/y.
Eighteen additional ports combined to receive 123,745 tons of Wire rod imports thus far in 2017, 8.7% of the total volume YTD. Year to date 2016, the same 18 ports took in 92,168 tons, so the volume was up 34.2% thus far in 2017.
At Gerdau we closely follow trade in long products steel since it has a profound impact on domestic market share and material pricing. We want you, our valued customers to have access to current information that can help you better plan and operate your businesses.