

U.S. Wire Rod Final Imports
Wire rod final imports to the U.S. were up 14.1% year to date (YTD), year on year (y/y), and totaling 1,262,595 tons for the six months ending July 2017. July’s tonnage recorded 183,584 tons, 2.1% higher than the January to June average volume of 179,835 tons
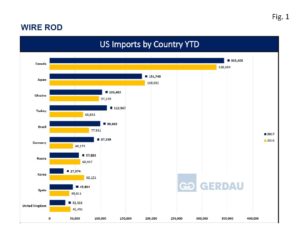 Figure 1 charts the largest exporting countries in rank order on a YTD basis through July for both 2016 and 2017.
Canada was the largest exporter with 343,406 tons, up 4.5% YTD y/y. July’s tonnage was 40,141 tons, 20.5% lower than the January to June average of 50,544 tons. Japan sent 181,748 tons to the U.S. YTD, down 3.3% YTD y/y. July’s volume came in at 26,744 tons, 3.5% more than the January to June average of 25,834 tons. Turkey ranked third YTD with 112,967 tons, surging 71.5% YTD y/y. Surprisingly, for the month of July, Turkey did not export any merchant tons. Its YTD average was 18,828 tons. Ukraine sent 103,482 tons of wire rod to the U.S., up 6.4% YTD y/y. Its shipment volumes have been erratic ranging from zero tons shipped in June to 30,825 tons in February. July’s export tonnage was 16,218, 11.5% more than its YTD average through June.
Canada, Japan, Turkey and Ukraine combined to account for 741,603 tons for 58.7% of total wire rod imports.
Brazil exported 99,465 tons of rod, gaining 28.3% YTD y/y. July’s volume was 11,731 tons, 19.8% lower than its January to June average volume of 14,622 tons. Germany was the next largest with 87,339 tons, up 89.1% YTD y/y. Volume for the month of July was 34,189 tons, nearly four times its January to June average of 8,858 tons. Russia brought in 57,893 tons wire rod to the U.S. YTD, 4.3% less than for the same timeframe last year. In July, Russian exports of rod totaled 6,297 tons, 26.7% lower than its January to June average of 8,599 tons. Spain’s YTD y/y volume increased by 18.0% to 45,804 tons. July tons were 3,570, 50.7% lower than its January to June average of 7,039 tons. Mexico YTD wire rod exports were 37,150 tons, up 15.5% YTD y/y. Mexico exported 6,102 tons in July, up 17.9% from its January through June average of 5,175 tons.
South Africa was the 10th largest exporter of wire rod to the U.S. with 31,156 tons YTD. South Africa did not export any tons in July vs. its YTD average of 4,451 tons. Close behind South Africa were both the United Kingdom with 31,116, down 24.9%, YTD y/y and Italy with 29,881 tons, YTD y/y. Italy only had 9 tons of rod exports to the U.S. YTD 2016. July exports for the U.K. were 6,370 tons, 54.5% higher than its January to June average of 4,124 tons. Italy’s July exports were 272 tons. Italy’s rod exports have been very erratic ranging from zero tons in February and May to 14,928 tons in April. Its YTD average was 4,268 tons.
Sixteen other countries exported a combined total of 101,185 tons, 8.0% of wire rods to the US market YTD 2017.
New Orleans was the largest receiving port, offloading 429,783 tons YTD, up 29.9%, YTD y/y. Detroit held the number two spot with 249,585 tons, up 8.4%, YTD y/y. Tampa ranked third with 85,470 tons, up 8.3%, YTD y/y. Ogdensburg NY was the next largest port bringing in 78,589 tons YTD, a decrease of 8.3% YTD y/y. Houston-Galveston took-in 76,803 tons, up 27.9 %, YTD y/y. Charleston received 66,198 tons, off 19.3%, YTD y/y. Philadelphia brought-in 63,473 tons, gaining 18.9%, YTD y/y. Mobile took-in 45,053 tons YTD, up 37.8%, YTD y/y. Savannah offloaded 42,385 tons, down 11.7%, YTD y/y.
The 10th largest wire rod receiving port was Laredo TX, with 27,992 tons, surging 49.5% YTD y/y. Eighteen additional ports combined to receive 97,266 tons of Wire rod imports thus far in 2017, 7.7% of the total volume YTD.
At Gerdau we closely follow trade in long products steel since it has a profound impact on domestic market share and material pricing. We want you, our valued customers to have access to current information that can help you better plan and operate your businesses.