

U.S. Steel Special Bar Quality Final Imports
SBQ final imports to the U.S. were up 27.4% in 2017, year on year (y/y), totaling 570,523 tons for the twelve months ending December 2017. January 2018 SBQ imports came in at tons, 39,926 or 5.0% lower than the 42,025 ton January 2017 volume.
There are nineteen HTS codes that contribute to our definition of SBQ. The top six account for 62% of the total. These include: SBQ Round (0.25 - 0.6 Carbon) < 76mm Dia. = 5,083 tons, Coil (>0.1% lead) = 5,052 tons, Other SBQ = 3,927 tons, Round (Cold Finished, <0.1% lead) = 3,740 tons and Round (Cold finished, >0.1% lead) = 3,621tons
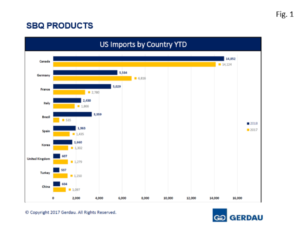 Figure 1 charts the largest exporting countries in rank order for January for both 2018 and 2017.
Canada was the largest exporter in January 2018 with 14,852 tons, up 5.2% year on year, (y/y). Germany sent 5,584 tons to the U.S. in January 2018, down 18.1% y/y. France ranked third with 5,029 tons up 80.9% y/y. Brazil sent 3,359 tons of SBQ to the U.S. in January 2018, better than a five-fold increase % y/y.
Italy exported 2,430 tons of SBQ products to the U.S. in January, up 30.2% y/y. Spain exported 1,963 tons, up 36.8% y/y. Korea sent 1,660 tons, up 27.5% y/y. Sweden exported 952 tons of SBQ to the U.S. in January 2018, climbing 86.0% y/y. The United Kingdom’s volume of SBQ exports in January 2018 was 607 tons, 52.5% less than in January 2017. China exported 604 tons of SBQ, down from January 2017 volume of 1,097 tons. Turkey sent 537 tons in January, falling 57.0% y/y.
These eleven countries accounted for 92.8% of the total SBQ intake. There were 15 other countries that exported a combined 2,885 tons of SBQ in January 2018.
Table 1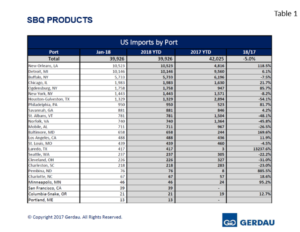 shows the entry port into the U.S. for both January 2018 and January 2017 and the percentage change y/y.
New Orleans, was the largest receiving port for January 2018, receiving 10,523 tons, climbing 119% y/y. Detroit offloaded 10,146 tons in January, up 6.1% y/y. Buffalo ranked third with 5,733 tons down 7.5% y/y. Chicago brought-in 1,983 tons, gaining 21.7% y/y. Ogdensburg NY took-in 1,758 tons of SBQ this January, increasing its intake by 85.7% y/y. New York received 1,443 tons, down 8.2% vs. January 2017. Houston/Galveston was the next largest port bringing in 1,329 tons, an decrease of 54.1% y/y. Philadelphia took-in 950 tons, up 81.7% y/y. Savannah offloaded 881 tons of SBQ in January, a 4.2% increase y/y. Rounding-out the top, St. Albans VT offloaded 781 tons, falling 48.1% y/y.
Fifteen other ports combined to receive 4,396 tons of SBQ imports in January 2018, 11.0% of the total volume in January 2017. Year to date 2017 the same country’s combined shipments were 4,497 tons, 10.7% of January 2017 total SBQ imports.
At Gerdau we closely follow trade in long products steel since it has a profound impact on domestic market share and material pricing. We want you, our valued customers to have access to current information that can help you better plan and operate your businesses.