

U.S. Steel Merchant July Final Imports
Merchant final imports to the U.S. were up 3.1% year to date (YTD), year on year (y/y), totaling 340,977 tons for the seven months ending July 2017. July merchant imports came in at 41,046, 17.9% greater than the 49,989 ton January to June average volume.
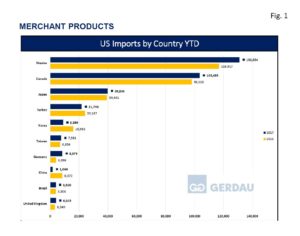 Figure 1 charts the largest exporting countries in rank order on a YTD basis through July for both 2016 and 2017. Mexico and Canada combined account for 68.8% of the total, up from 65.0% YTD 2016.
Mexico was the largest exporter with 131,024 tons, up 12.1% YTD y/y. July’s volume at 16,228 tons, was 15.2% greater than its 19,133 ton January to June average volume. Canada sent 103,485 tons to the U.S. YTD, up 5.6% y/y. July exports were 11,575 tons, 24.4% higher than the 15,318 ton average through the first six months of the year. Japan ranked third YTD with 39,836, up 1.1% YTD y/y. For the month of July, Japanese exports were 4,039 tons, 32.3% lower than its January to June average of 5,966 tons. Turkey sent 21,793 tons of merchants to the U.S., off 9.7% YTD y/y. July volume was 1,964 tons, down 40.6% compared to its 3,305 ton January to June average volume.
Korea in 5th place exported 8,894 tons YTD, falling 44.2% y/y. July volume came in at 1,779 tons, 50.0% greater than its January to June average volume of 1,186 tons. Germany was the next largest with 8,375 tons, up 109.6% YTD y/y. German merchant exports in July were 2,384 tons, 139% higher than its January to June average volume of 999 tons
Taiwan was the next largest with 7,581 tons, up 10.6% YTD y/y. Volume for the July was just 40 tons, well off its 1,257 ton monthly average over the first six months of the year. The United Kingdom’s YTD volume of merchant exports to the U.S. was 4,019 tons, 23.3% more than YTD 2016. July’s exports were 527 tons, close to its January to June average of 583 tons. Brazil sent 3,920 tons of merchant products to the U.S. YTD, up 3.0% y/y. Volume for the month of July fell to 110 tons, far below its January to June average of 635 tons. The Czech Republic exported 2,268 tons of merchants to the U.S. through July, up 76.0% y/y. The Czech Republic only exported tonnage in March, May and June YTD.
These top ten countries account for 97.2% of the total merchant intake. There were 19 other countries that exported a combined 9,683 tons of merchants YTD 2017.
Laredo Texas was the largest receiving port, offloading 90,973 tons YTD, up 16.9% YTD y/y. Detroit held the number two spot with 67,417 tons, flat YTD y/y. New Orleans ranked third with 30,072 tons rising 2.6% YTD y/y. Houston/Galveston was the next largest port bringing in 24,064 ton YTD, an increase of 14.1% YTD y/y. San Diego, received 21,495 tons, flat YTD y/y. Buffalo took-in 19,834, climbing 10.9% YTD y/y. El Paso was the 7th largest receiver of U.S. merchants with 17,722 tons, up 2.4% YTD y/y. Los Angeles offloaded 15,408 tons, down 5.9% YTD y/y. Savannah was next with 11,141 tons, tumbling 31.1% YTD y/y.
Rounding-out the top 10 was Ogdensburg NY, bringing in 9,474 tons, up 36.6% YTD y/y. Twenty-four additional ports combined to receive 52,872 tons of merchant imports thus far in 2017, 15.5% of the total volume YTD.
At Gerdau we closely follow trade in long products steel since it has a profound impact on domestic market share and material pricing. We want you, our valued customers to have access to current information that can help you better plan and operate your businesses.