

U.S. Steel Merchant Final Imports
Merchant final imports to the U.S. were down 33% YoY, and up 67% MoM in March 2019, coming in at 26,730 tons. The top five account for 64% of the total intake. These include: Light angles (<3” = 7,508 tons), MBQ (coil >0.75” dia. = 4,372 tons), MBQ (rectangular <0.25 carbon, max cross section <152 mm dia. = 4,341 tons), Structural channels (>3,15” = 4,084 tons) and Light channels (>3,15” = 3,680 tons)
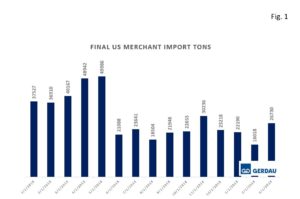 Figure 1 further breaks down total final merchant imports from January 2018 – March 2019. When comparing year to date figures from 2018 and 2019, 2019 imports came in at 64,938, down 43% from 2018 (114,604 tons) .
Figure 2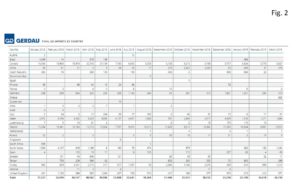 charts the largest exporting countries through January for both 2019 and 2018. Mexico and Canada combined account for 73.1% of the total in March 2019, down slightly from 74% in 2018. Mexico was the largest exporter with 13,912 tons, up 12.0% y/y. Canadian imports have declined significantly YoY, exporting 15,974 in March 2018 vs 5,627 in March 2019.
Laredo, TX port was the largest receiver of U.S. merchants in March 2019, receiving 10,796 tons of the total 26,730. Detroit, MI port was the second largest receiver coming in at 2,921 tons and the Houston/Galveston, TX port was the third largest receiver coming in at 2,866 tons. Together, these top three receiving ports collected 62% of all U.S. merchant imports
At Gerdau we closely follow trade in long products steel since it has a profound impact on domestic market share and material pricing. We want you, our valued customers to have access to current information that can help you better plan and operate your businesses.