

U.S. Steel Merchant Final Imports
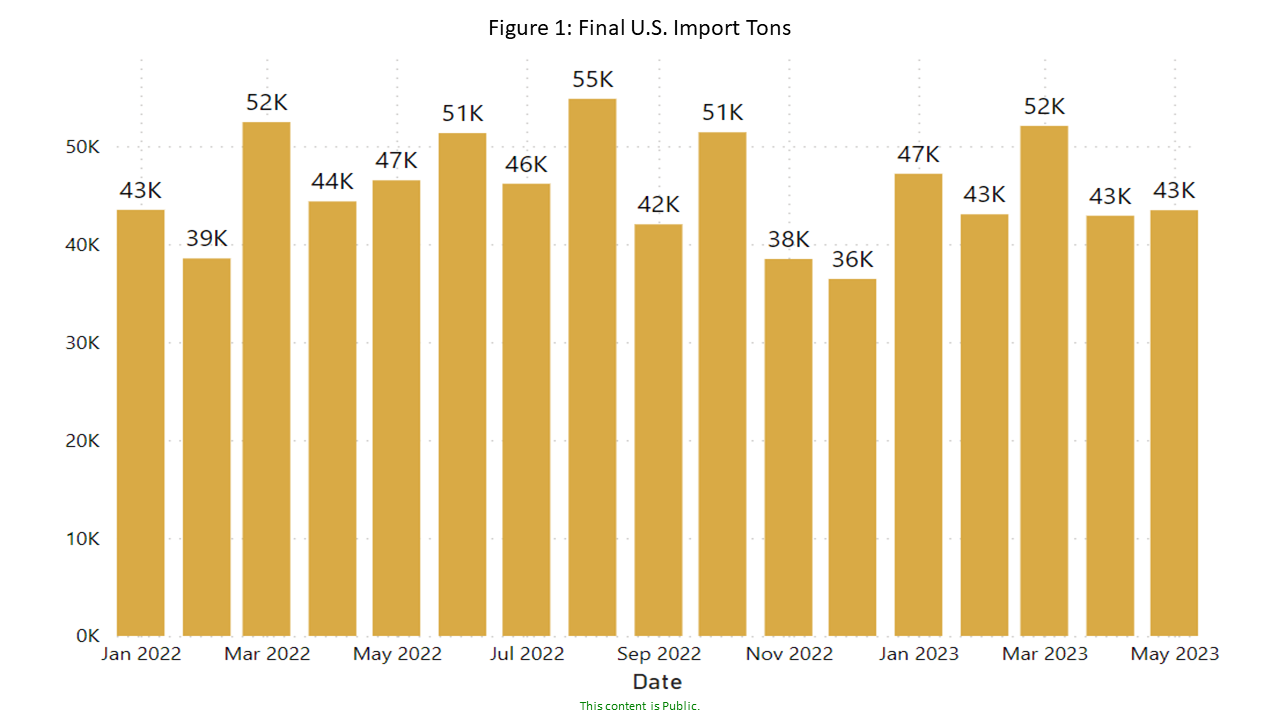
U.S. Steel Merchant Final Imports: Final merchant imports to the U.S. came in at 43,458 tons in May 2023, increasing 1.3% month over month (m/m).
Figure 1 further breaks down total merchant imports from January 2022 – May 2023.
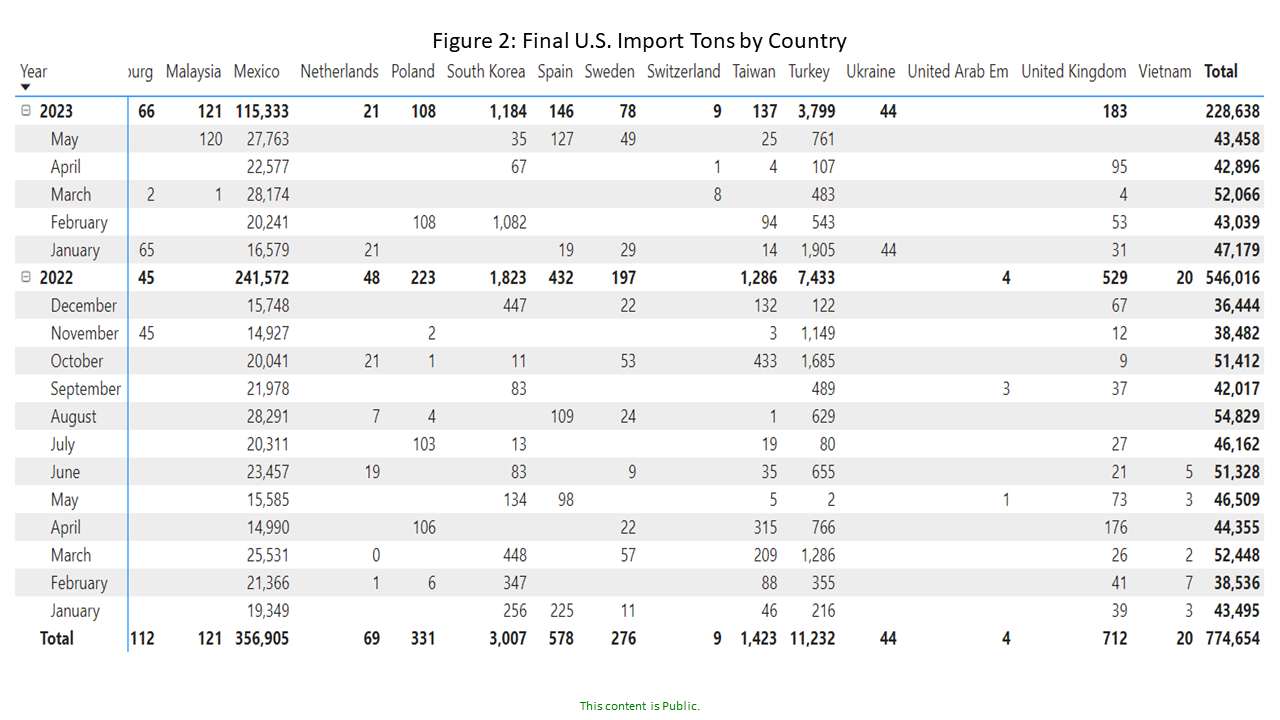
Figure 2 charts the largest exporting countries in rank order through May. Mexico and Canada, combined, account for 94% of the total this month. Mexico was the largest exporter to the U.S. with 27,763 tons; Canadian imports came in at 12,956 tons.
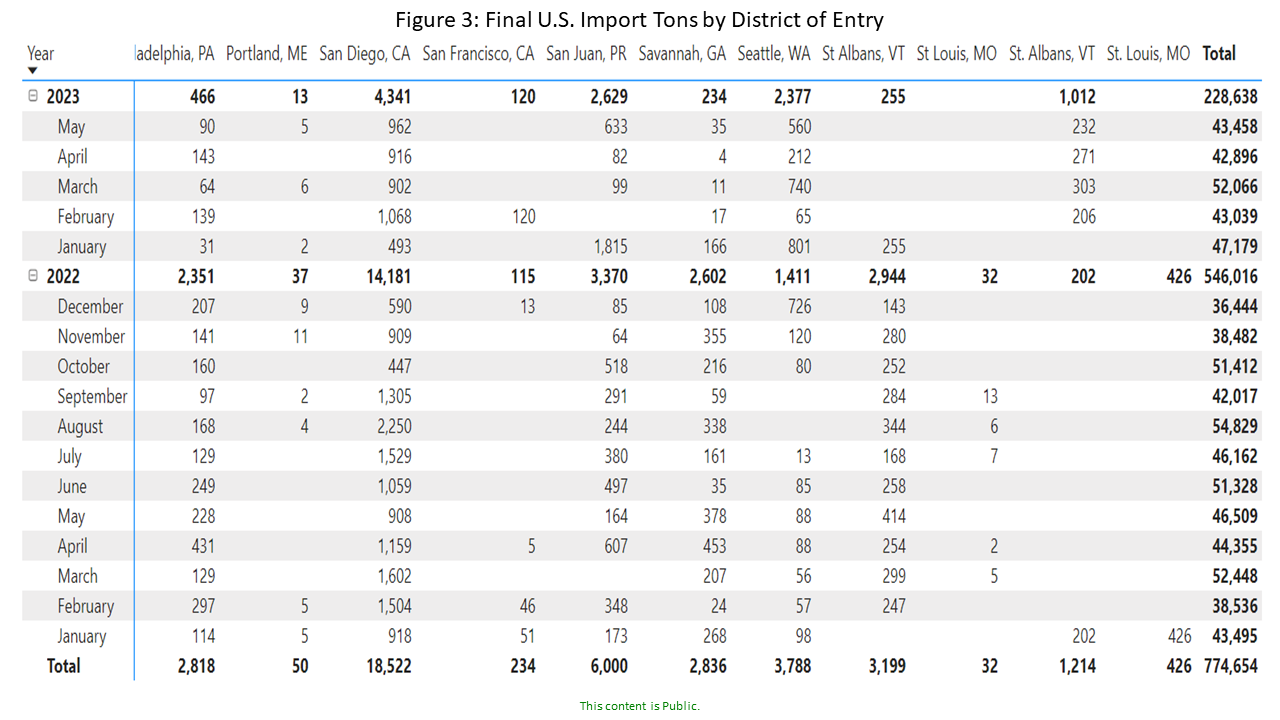
Figure 3 also charts the largest imports by district of entry into the U.S. in rank order. Laredo, TX was the largest receiver of merchants this month, receiving 22,849 tons of the total. Detroit, MI was next, coming in at 7,692 tons, while El Paso, TX was the third-largest receiver, coming in at 3,901 tons. Together, these top three receiving ports collected 79% of all U.S. merchant imports.
Please note the format of Figure 2 and Figure 3 has changed. Countries are listed alphabetically left to right and month/year is on the y-axis. There are listed totals YTD for each country and district of entry, respectively.
At Gerdau, we closely follow trade in long product steel since it has a profound impact on domestic market share and material pricing. We want you, our valued customers, to have access to current information that can help you better plan and operate your businesses.