

U.S. Steel Merchant Final Imports
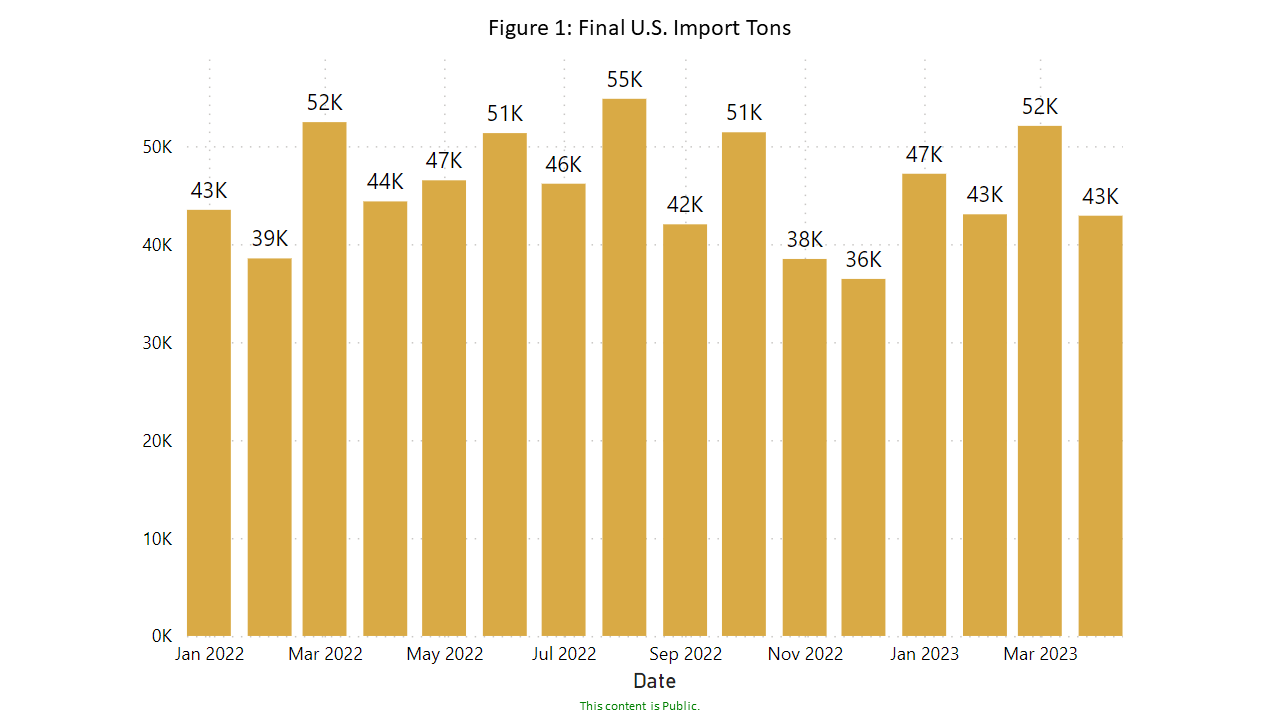
U.S. Steel Merchant Final Imports: Final merchant imports to the U.S. came in at 42,896 tons in April 2023, decreasing 18% month over month (m/m).
Figure 1 further breaks down total merchant imports from January 2022 – April 2023.
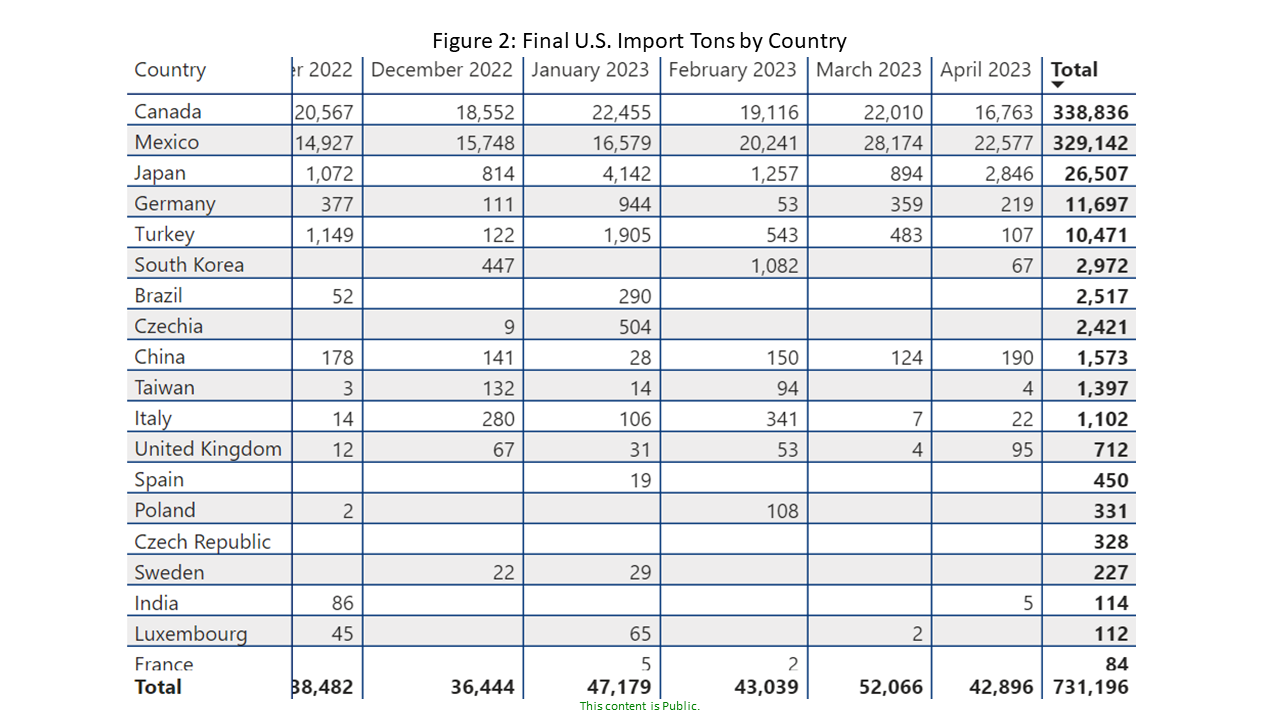
Figure 2 charts the largest exporting countries in rank order through April. Mexico and Canada, combined, account for 92% of the total this month. Mexico was the largest exporter to the U.S. with 22,577 tons; Canadian imports came in at 16,763 tons.
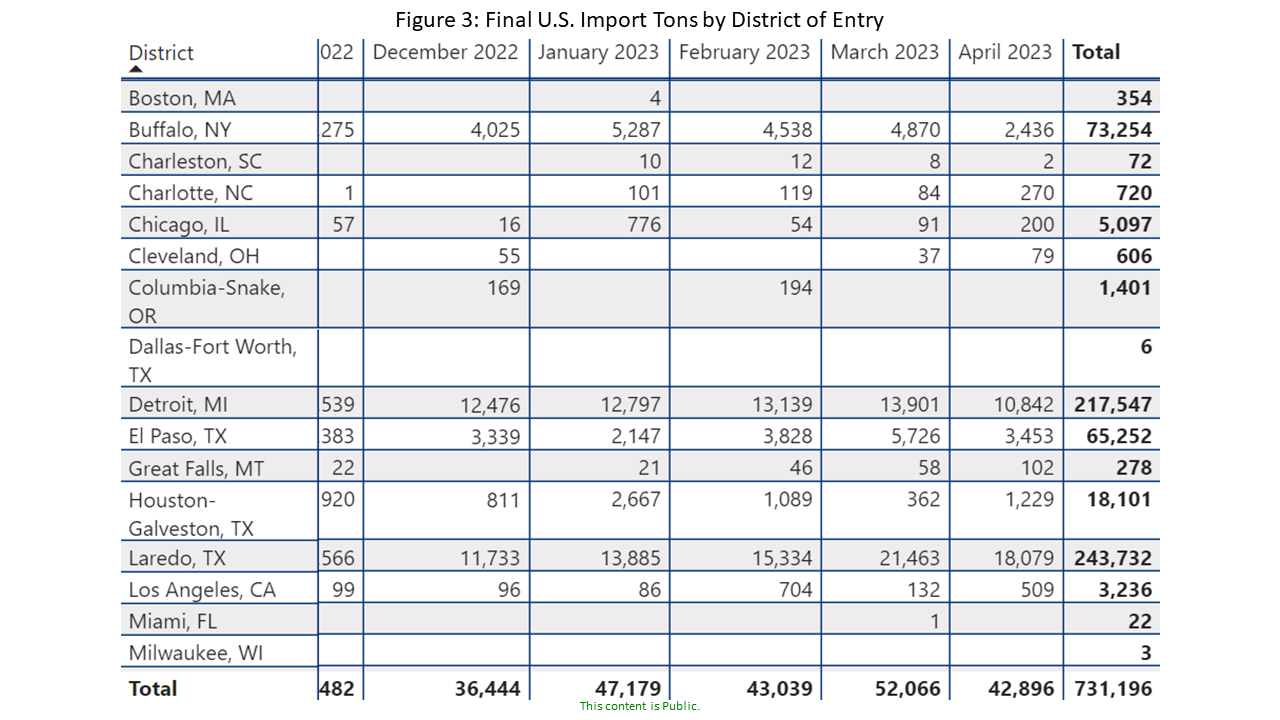
Figure 3 also charts the largest imports by district of entry into the U.S. in rank order. Laredo, TX was the largest receiver of merchants this month, receiving 18,079 tons of the total. Detroit, MI was next, coming in at 10,842 tons, while El Paso, TX was the third-largest receiver, coming in at 3,453 tons. Together, these top three receiving ports collected 75% of all U.S. merchant imports.
At Gerdau, we closely follow trade in long product steel since it has a profound impact on domestic market share and material pricing. We want you, our valued customers, to have access to current information that can help you better plan and operate your businesses.