

U.S. Steel Merchant Final Imports
Merchant final imports to the U.S. were up 1.2% in 2017, year on year (y/y), totaling 541,630 tons for the twelve months ending December 2017. December merchant imports came in at 28,433 tons, 37.0% less than the 45,135 ton 2017 average volume.
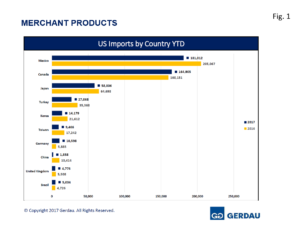 Figure 1 charts the largest exporting countries in rank order on a 2017 basis through December for both 2016 and 2017. Four new HTS codes were added last month with history back to July, (they are all MBQ round and rectangular shapes). These tonnages are added into the 2017 totals discussed below, but are not reflected in Figure 1. The tonnage for the four additional HTS codes amounts to 49,736 for the July to December timeframe.
Mexico and Canada combined account for 69.4% of the total in 2017, up from 66.8% in 2016. Mexico was the largest exporter with 196,087 tons, down 4.4% y/y. December’s volume at 9,330 tons was 42.3% lower than its 16,340 ton average volume in 2017. Canada sent 180,005 tons to the U.S. in 2017, up 12.4% y/y. December exports were 12,414 tons, 17.2% less than its 15,000 ton average for the year.
Japan ranked third with 58,806 tons, off 9.1% y/y. Japan did not export any tons on December. Turkey sent 32,330 tons of merchants to the U.S., off 8.6% y/y. December volume was 1,303 tons, half of its 2,694 ton 2017 average volume. Korea exported 14,630 tons 2017, falling 32.3% y/y. December volume came in at 92 tons, a fraction of its 1,219 ton per month average. Germany exported a total of 12,153 tons to the U.S. in 2017, 107% more than 2016. German merchant exports in December were 486 tons, about one half of its 2017 average volume of 1,027 tons.
Taiwan sent 11,359 tons of merchant to the U.S. in 2017, down 34.1% y/y. For the month of December, Taiwan exported 267 tons, 71.8% less than its 947 average for the year. Brazil sent 10,405 tons of merchant products to the U.S. in 2017, up 120% y/y. Brazil exported 205 tons in December, 79.5% less than its 999 ton average 2017. The United Kingdom’s 2017 volume of merchant exports to the U.S. was 7,001 tons, 27.1% greater than in 2016. December’s exports were 157 tons, 80.0% lower than its 2017 average of 583 tons.
South Africa’s 2017 total was 3,547 tons having shipped in only three months in 2017. Year on year volume was up 365%. South Africa did not export any merchant tons to the U.S. in December. The Czech Republic exported 4,031 tons of merchants to the U.S. through December, up 82.2% y/y. The Czech Republic exported zero tons in December. Spain was the next largest with 3,099 tons, down 35.8% y/y. Volume for the December was 598 tons, 131% more than its 2017 average of 258 tons per month.
These twelve countries account for 98.4% of the total merchant intake. There were sixteen other countries that exported a combined 6,643 tons of merchants in 2017. In 2016 the same 16 country’s exported 19,130 tons, including 10,414 tons from China.
Laredo Texas was the largest receiving port, offloading 123,264 tons 2017, down 10.8% y/y. December intake was 7,719 tons. Detroit held the number two spot with 110,236 tons, up 0.2% y/y. December receipts were 7,993 tons. New Orleans ranked third with 41,830 tons down 7.4% y/y. December intake was 3,252 tons. Houston/Galveston was the next largest port bringing in 30,758 tons in 2017 down 5.9% y/y. December intake was 645 tons. San Diego, received 30,729 tons, lower by 14.1% y/y. December intake was 1,093 tons.
Buffalo took-in 28,529 tons, up 5.3% y/y. Intake in December was 1,798 tons. El Paso was the 7th largest receiver of U.S. merchants with 25,864 tons, down 15.3% y/y. December intake was 577 tons.
Los Angeles offloaded 20,604 tons, down 32.9% y/y. December intake was 349 tons. Savannah was next with 17,263 tons, lower by 29.9% y/y. December receipts totaled 71 tons.
Rounding-out the top 10 was Ogdensburg NY, bringing in 16,806 tons, up 21.5% y/y. December intake was 1,504 tons.
Twenty-five additional ports combined to receive 45,910 tons of merchant imports in 2017, 8.5% of the total volume 2017. The same 25 ports took-in 40,908 tons in 2016.
At Gerdau we closely follow trade in long products steel since it has a profound impact on domestic market share and material pricing. We want you, our valued customers to have access to current information that can help you better plan and operate your businesses.