

U.S. Steel Merchant Final Imports
Merchant final imports to the U.S. were flat year to date (YTD), year on year (y/y), totaling 378,068 tons for the eight months ending August 2017. August merchant imports came in at 37,091 tons, 21.5% less than the 47,259 ton YTD average volume.
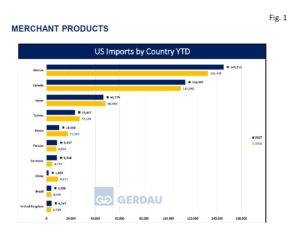 Figure 1 charts the largest exporting countries in rank order on a YTD basis through August for both 2016 and 2017. Mexico and Canada combined account for 68.7% of the total, up from 64.1% YTD 2016. Mexico was the largest exporter with 145,512 tons, up 9.6% YTD y/y. August’s volume at 14,488 tons, was 20.3% lower than its 18,189 ton YTD average volume. Canada sent 114,037 tons to the U.S. YTD, up 3.3% y/y. August exports were 10,551 tons, 26.0% less than the 14,255 ton YTD average through the first eight months of the year.
Japan ranked third YTD with 46,775 tons, off 3.5% YTD y/y. For the month of August, Japanese exports were 6,939 tons, 19.2% greater than its YTD average of 5,847 tons. Turkey sent 23,437 tons of merchants to the U.S., off 13.8% YTD y/y. August volume was 1,644 tons, down 43.9% compared to its 2,930 ton YTD average volume. Korea exported 10,388 tons YTD, falling 40.9% y/y. August volume came in at 1,494 tons, 15.1% greater than its January to June average volume of 1,299 tons. Taiwan was the next largest with 8,637 tons, up 7.4% YTD y/y. Volume for the August was 1,056 tons, close to its 1,080 ton monthly average over the first eight months of the year. Germany sent 8,528 tons, up 79.1% YTD y/y. German merchant exports in August were only 143 tons, much lower than its YTD average volume of 1,065 tons
The United Kingdom’s YTD volume of merchant exports to the U.S. was 4,147 tons, 11.9% more than YTD 2016. August’s exports were 128 tons, 75.3% lower than its average of 518 tons. Brazil sent 3,920 tons of merchant products to the U.S. YTD, off 2.9% y/y. Brazil did not send any merchant tons to the U.S, in August. The Czech Republic exported 2,368 tons of merchants to the U.S. through August, up 76.0% y/y. The Czech Republic only exported tonnage in March, May and June YTD.
These top ten countries account for 97.3% of the total merchant intake. There were 19 other countries that exported a combined 10,586 tons of merchants YTD 2017. Year to date 2016 the same 19 country’s exported almost twice as much totaling 19,875 tons.
Laredo Texas was the largest receiving port, offloading 99,847 tons YTD, up 14.1% YTD y/y. Detroit held the number two spot with 74,727 tons, down 2.0% YTD y/y. New Orleans ranked third with 32,491 tons falling 1.5% YTD y/y. Houston/Galveston was the next largest port bringing in 27,238 tons YTD, an increase of 11.7% YTD y/y. San Diego, received 24,832 tons, flat YTD y/y. Buffalo took-in 21,259 tons, climbing 6.6% YTD y/y. El Paso was the 7th largest receiver of U.S. merchants with 19,928 tons, down 0.8% YTD y/y. Los Angeles offloaded 17,701 tons, down 8.9% YTD y/y. Savannah was next with 12,945 tons, lower by 28.1% YTD y/y. Rounding-out the top 10 was Ogdensburg NY, bringing in 10,708 tons, up 33.3% YTD y/y.
Twenty-four additional ports combined to receive 36,391 tons of merchant imports thus far in 2017, 9.6% of the total volume YTD. The same 24 ports took-in 42,174 tons YTD 2016, +13.7%.
At Gerdau we closely follow trade in long products steel since it has a profound impact on domestic market share and material pricing. We want you, our valued customers to have access to current information that can help you better plan and operate your businesses.