U.S. Steel Capacity Utilization
US steel production reached its highest capacity utilization rate since the week ending January 31, 2015. The identical 76.4% capacity utilization rate was achieved for the week ending August 12, 2017 at an output of 1.780 million tons (Mt). The most recent four week capacity utilization rate was 76.0% at an average production rate of 1.771 Mt per week.
 Figure 1 shows production on the left-hand scale and capacity utilization as a percent on the right-hand scale. Production and capacity utilization have been moving steadily higher so far in 2017. Production year to date, (YTD) was 55,650 Mt, at an average of 1,739 Mt per week. The average capacity utilization YTD was 74.1%. Over the same 32 week period in 2016, the YTD total was 54,387 at an average of 1,700 Mt per week with an average capacity utilization of 72.6%. Summarizing the YTD year over year, (y/y) improvement: +39,000 tons per week, +1.263 Mt total tons, and +1.5 percentage point increase in the capacity utilization rate.
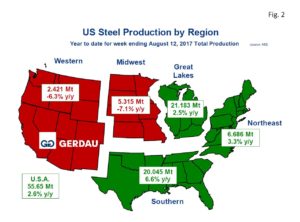
Figure 2 presents a map of the US with the five steel producing zones. The Great Lakes produced the most steel, with 21.183 Mt, YTD, up 2.5% y/y. The Southern region was a close second with 20.045 Mt YTD up 6.6% y/y. With 6.686 Mt YTD, the Northeast tonnage increased by 3.3% YTD y/y. The Midwest and Western zones both produced less steel YTD compared to the same timeframe a year ago. The Midwest produced 5.315 Mt YTD, down 7.1% y/y, while the West produced 2.421 Mt YTD down 6.3% y/y.
Examining the production statistics on a 3 month moving total (3MMT), y/y basis, presents a different picture. Nationally the 3MMT y/y was up 0.5%. The Northeast recorded the highest percentage change with 4.1%, 3MMT y/y, followed by the Southern region, up 2.9%. The Midwest tonnage was weaker by 0.7%, while the Great Lakes (-2.0%) and Western zone (-4.9%) also posted declines.
Momentum (3MMT minus 12MMT), was positive in all regions except the Great Lakes (-3.0%). Nationwide momentum was +2.7%. The Midwest had the strongest momentum with 13.1%, followed by the Northeast with 7.4%. The South came-in at 3.4% and the West at 3.0%.
Overall the latest raw steel production and capacity utilization report is encouraging.
At Gerdau, we track US steel production and capacity utilization to keep an eye on the overall health of the US steel industry. We feel it is important to understand the forces that influence steel demand to include the strength of the US economy and import penetration.

