

U.S. Steel Capacity Utilization
The total tonnage for the week ending September 14th was 1,811 million tons, (Mt) at a capacity utilization rate of 77.9%. The year to date tonnage output is 69,983 Mt, at an average capacity utilization rate of 81.1%. In 2018, the same output total was 64,240 Mt at 76.3%.
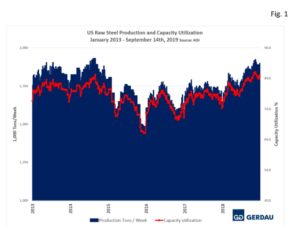 Figure 1 shows production on the left-hand scale and capacity utilization as a percent on the right-hand scale. Capacity utilization and production tapered off at the end of the year as is typical for November and December.
Figure 2 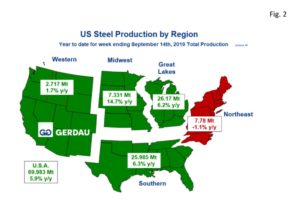 presents a map of the U.S. with its five steel producing zones. The nation as a whole produced 5.9% more steel than for the same period in 2018. The Great Lakes region was the largest steel producing region, with 26.17 Mt through September 14th, up 6.2% y/y. The Southern region habitually the second largest, produced 25.985 Mt up 6.3% y/y. At 7.78Mt, the Northeast region ranked third largest. The Northeast tonnage moved-down slightly by 1.1% y/y. The Midwest produced 7.331 Mt, up 14.7% y/y, while the Western zone produced 2.717 Mt, up 1.7% y/y.
At Gerdau, we track US steel production and capacity utilization to keep an eye on the overall health of the US steel industry. We feel it is important to understand the forces that influence steel demand to include the strength of the US economy and import penetration.