

U.S. Steel Capacity Utilization
The total tonnage for the week ending July 6th was 1,847 million tons, (Mt) at a capacity utilization rate of 79.4%. The first time the capacity utilization has been under 80 percent since the week of January 12th, 2019. The year to date tonnage output is 51,366 Mt, at an average capacity utilization rate of 81.5%. In 2018, the same output total was 47,652 Mt at 75.5%.
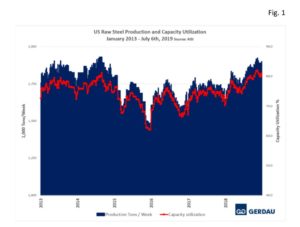 Figure 1 shows production on the left-hand scale and capacity utilization as a percent on the right-hand scale. Capacity utilization and production tapered off at the end of the year as is typical for November and December.
Figure 2 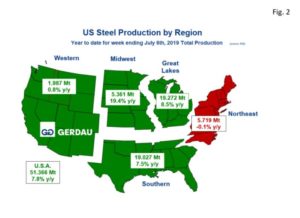 presents a map of the U.S. with its five steel producing zones. The nation as a whole produced 7.8% more steel than for the same period in 2018. The Great Lakes region was the largest steel producing region, with 19.272 Mt through July 6th, up 8.5% y/y. The Southern region habitually the second largest, produced 19.027 Mt up 7.4% y/y. At 5.719 Mt, the Northeast region ranked third largest. The Northeast tonnage moved-down slightly by 0.1% y/y. The Midwest produced 5.361 Mt, up 19.4% y/y, while the Western zone produced 1.987 Mt, up 0.8% y/y.
Looking at raw steel production on a twelve month moving total, (12MMT) basis, we see that; The Great Lakes region produced 36,583 Mt, up 2.9% y/y. The Southern zone made 36,122 Mt, up 7.5% y/y. The Northeast region produced 11,149 Mt for a 2.9% increase y/y. The Midwest generated 10,272 Mt, up 19.7% y/y. The Western region produced 4,002 Mt, up 5.9% on a y/y basis. Total U.S. production, (12MMT) was 98,128 Mt, up 7.9% y/y.
At Gerdau, we track US steel production and capacity utilization to keep an eye on the overall health of the US steel industry. We feel it is important to understand the forces that influence steel demand to include the strength of the US economy and import penetration.