

U.S. Steel Capacity Utilization
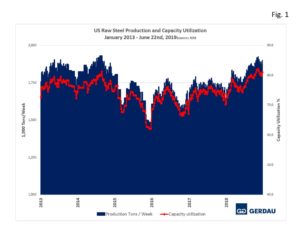 The total tonnage for the week ending June 22nd was 1,873 million tons, (Mt) at a capacity utilization rate of 80.5%, the twenty-third consecutive week where the utilization rate is over 80%. For the first 25 weeks of 2018, total tonnage output was 44,079Mt, at an average capacity utilization rate of 75.4%. For the same period this year, total tonnage output was 47,625Mt, at an average capacity utilization rate of 81.7%. Thus volume was up 8.1% year on year, (y/y), while capacity utilization was higher, up 6.3 percentage points.
Figure 1 shows production on the left-hand scale and capacity utilization as a percent on the right-hand scale. Capacity utilization and production tapered off at the end of 2018 as is typical for November/December, but has continually climbed since then. The last time the capacity utilization has trended above 80% consecutively was in 2008.
Figure 2 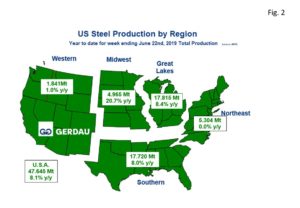 presents a map of the U.S. with its five steel producing zones. The nation as a whole produced 8.1% more steel than for the same period in 2018. The Great Lakes region was the largest steel producing region, with 17.815 Mt through June 22nd, up 8.4% y/y. The Southern region habitually the second largest produced 17.720 Mt up 8.0% y/y. At 5.304 Mt, the Northeast region ranked third largest. The Midwest produced 4.965 Mt, up 20.7% y/y, while the Western zone produced 1.841 Mt, up 1.0% y/y.
At Gerdau, we track US steel production and capacity utilization to keep an eye on the overall health of the US steel industry. We feel it is important to understand the forces that influence steel demand to include the strength of the US economy and import penetration.