

U.S. Steel Capacity Utilization
The total tonnage for the week ending February 16th was 1,886 million tons, (Mt) at a capacity utilization rate of 81.0%, which is the fifth consecutive month where the utilization has been over 80%. For the year of 2019, total tonnage output was 13,273Mt, at an average capacity utilization rate of 80.8%. In 2018, the same time period production total was 12,003Mt at 73.6%. Thus volume is up 7.7% year on year, (y/y), while capacity utilization is higher, up 7.2 percentage points.
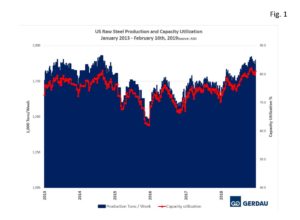 Figure 1 shows production on the left-hand scale and capacity utilization as a percent on the right-hand scale. After capacity utilization and production tapered off at the end of 2017 as is typical for November/December, it has continually climbed since then.
Figure 2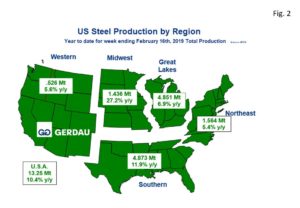 presents a map of the U.S. with its five steel producing zones. The nation as a whole produced 10.4% more steel than for the same period in 2018. The Great Lakes region was the largest steel producing region, with 4.851 Mt through February 16th, up 6.9% y/y. The Southern region habitually the second largest, produced 4.873 Mt up 11.9% y/y. At 1.564 Mt, the Northeast region ranked third largest. The Northeast tonnage moved-up by 5.4% y/y. The Midwest produced 1.436 Mt, up significantly at 27.2% y/y, while the Western zone produced .526 Mt, up 5.6% y/y.
At Gerdau, we track US steel production and capacity utilization to keep an eye on the overall health of the US steel industry. We feel it is important to understand the forces that influence steel demand to include the strength of the US economy and import penetration.