

U.S. Steel Capacity Utilization
The total tonnage for the week ending June 9th was 1,753 million tons, (Mt) at a capacity utilization rate of 74.8%. For the first 23 weeks of 2018, total tonnage output was 40,567 Mt, at an average capacity utilization rate of 75.5%. In 2017, the same 12 weeks production total was 39,885 Mt at 73.7%. Thus volume was up 1.7% year on year, (y/y), while capacity utilization was higher, up 1.8 percentage points.
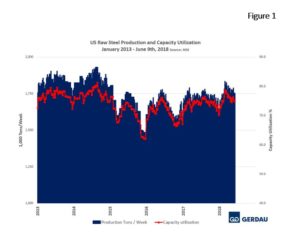 Figure 1 shows production on the left-hand scale and capacity utilization as a percent on the right-hand scale. Capacity utilization and production tapered off at the end of the year as is typical for November and December.
Figure 2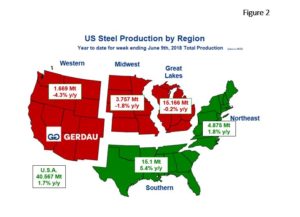 presents a map of the U.S. with its five steel producing zones. The nation as a whole produced 1.7% more steel than for the same period in 2017. The Great Lakes region was the largest steel producing region, with 15.166 Mt through June 9th, down 0.2% y/y. The Southern region habitually the second largest, produced 15.1 Mt up 5.4% y/y. At 4.875 Mt, the Northeast region ranked third largest. The Northeast tonnage moved-up by 1.8% y/y. The Midwest produced 3.757 Mt, down 1.8% y/y, while the Western zone produced 1.669 Mt, down 4.3% y/y.
Looking at raw steel production on a twelve month moving total, (12MMT) basis, we see that; The Great Lakes region produced 34,188 Mt, up 0.2% y/y. The Southern zone made 33,508 Mt, up 8.9% y/y. The Northeast region produced 10,819 Mt for a 2.5% increase y/y. The Midwest generated 8,505 Mt, up 0.1% y/y. The Western region produced 3,768 Mt, 1.0% lower on a y/y basis. Total U.S. production, (12MMT) was 90,788 Mt, up 3.5% y/y.
At Gerdau, we track US steel production and capacity utilization to keep an eye on the overall health of the US steel industry. We feel it is important to understand the forces that influence steel demand to include the strength of the US economy and import penetration.