

U.S. Steel Capacity Utilization
The total tonnage for the week ending January 6th was 1,649 million tons, (Mt) at a capacity utilization rate of 70.7%. On a four week moving average, (4WMA) basis, tonnage output was 1,676 Mt, at a capacity utilization rate of 71.9%. This week’s 4WMA was 1.4% higher than for the same period last year when the 4WMA total was 1,652 Mt.
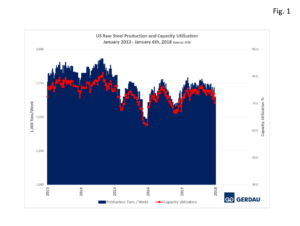 Figure 1 shows production on the left-hand scale and capacity utilization as a percent on the right-hand scale. Capacity utilization and production has been drifting lower for the past several weeks which is typical for the end of the year period.
Production for 2017 was 90,106 Mt, at an average of 1,733 Mt per week with an average capacity utilization of 74.0%. In 2016, the total was 88,463 at an average of 1,701 Mt per week with an average capacity utilization of 71.1%. Summarizing the year over year, (y/y) improvement: +23,000 tons per week, +1,643 Mt total tons, and +2.9 percentage point increase in the capacity utilization rate.
Figure 2 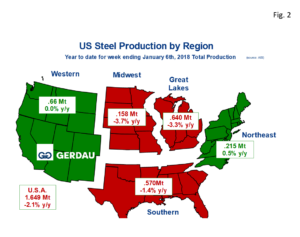 presents a map of the US with its five steel producing zones. The Great Lakes region was the largest steel producing region, with 0.640 Mt for week one of 2018, down 3.3% y/y. The Southern region was next with 0.570 Mt off 1.4% y/y. With 0.215 Mt, the Northeast region ranked third largest. The Northeast tonnage increased by 0.5% y/y. The Midwest produced .0158 Mt in the week ending January 6th, down 3.7% y/y, while the Western zone both produced 0.660 Mt, flat y/y.
Referencing Worldsteel Association’s latest press release shows that steel production around the world is higher in most regions, not just in the US. World crude steel production for the 66 countries reporting to worldsteel was 136.3 Mt in November 2017, a 3.7% increase compared to November 2016. China’s crude steel production for November 2017 was 66.2 Mt, an increase of 2.2% y/y. Japan produced 8.7 Mt of crude steel in November 2017, an increase of 1.0% compared to November 2016. In the EU, Italy’s crude steel production for November 2017 was 2.2 Mt, up by 3.3% y/y. France produced 1.2 Mt of crude steel in November 2017, a decrease of -8.7% y/y. Spain produced 1.3 Mt in November 2017, an increase of 18.0% y/y. Turkey’s crude steel production for November 2017 was 3.1 Mt, up by 7.0% y/y. Brazil’s crude steel production for November 2017 was 3.0 Mt, up by 15.3% y/y. The crude steel capacity utilization ratio of the 66 countries in November 2017 was 70.7%. This is 1.5 percentage points higher than November 2016.
At Gerdau, we track US steel production and capacity utilization to keep an eye on the overall health of the US steel industry. We feel it is important to understand the forces that influence steel demand to include the strength of the US economy and import penetration.