

U.S. Steel Capacity Utilization
Total tonnage for the week ending November 25th was 1,703 million tons, (Mt) at a capacity utilization rate of 73.0%, 1.9 percentage points lower than the previous week. On a four moving average, (4WMA) basis, the capacity utilization rate was 0.5 percentage point lower at 74.0%. The 4WMA tonnage was 1,726Mt, 8.1% greater than the same period last year.
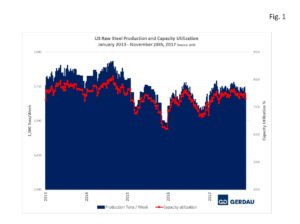 Figure 1 shows production on the left-hand scale and capacity utilization as a percent on the right-hand scale. Production and capacity utilization began the year on a sharp upward trajectory but have fallen-back since peaking in mid-August at 76.4% and have plateaued at near 74% over the past 12 weeks. This week’s 73.0% was the lowest capacity utilization rate since the 2nd week of April.
Production year to date, (YTD) was 81,661 Mt, at an average of 1,737 Mt per week with an average capacity utilization of 74.2%. Over the same 47 week period in 2016, the YTD total was 78,634 at an average of 1,673 Mt per week with an average capacity utilization of 71.4%. Summarizing the YTD year over year, (y/y) improvement: +64,400 tons per week, +3.03 Mt total tons, and +2.8 percentage point increase in the capacity utilization rate.
Figure 2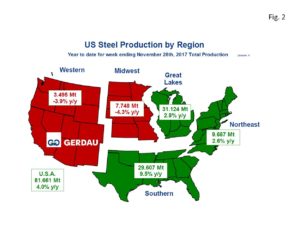 presents a map of the US with the five steel producing zones. On a national basis, steel production was higher by 4.0% YD y/y. The Great Lakes produced the most steel, with 31.12 Mt, YTD, up 2.8% y/y. The Southern region was next with 29.61 Mt YTD up 9.5% y/y. With 9.69 Mt YTD, the Northeast increased its tonnage by 2.6% YTD y/y. The Midwest and Western zones both produced less steel YTD compared to the same timeframe a year ago. The Midwest produced 7.75 Mt YTD, down 5.3% y/y, while the West produced 3.50 Mt YTD down 3.9% y/y.
Examining the production statistics on a 3 month moving total (3MMT), y/y basis, helps smooth out m/m volatility. Nationally the 3MMT y/y was down 1.0%. The Great Lakes region volume was higher by 0.3% 3MMT y/y. The Southern zone was flat, 3MMT y/y. The Northeast production was down 4.9% 3MMT y/y. The Midwest tonnage declined by 2.6% while the Western zone saw its production fall by 6.2%, 3MMT y/y.
At Gerdau, we track U.S. steel production and capacity utilization to keep an eye on the overall health of the U.S. steel industry. We feel it is important to understand the forces that influence steel demand to include the strength of the US economy and import penetration.