

U.S. Steel Capacity Utilization
The total tonnage for the week ending November 7th was 1,715 million tons, (Mt) at a capacity utilization rate of 73.6%. On a four moving average, (4WMA) basis, tonnage output was also 1,732 Mt, at a capacity utilization rate of 74.3%. This week’s 4WMA was 7.2% higher than for the same period last year when the 4WMA total was 1,591 Mt.
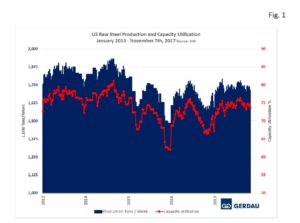 Figure 1 shows production on the left-hand scale and capacity utilization as a percent on the right-hand scale. Production and capacity utilization have been trending higher so far in 2017.
Production year to date, (YTD) was 76,474 Mt, at an average of 1,738 Mt per week with an average capacity utilization of 74.2%. Over the same 44 week period in 2016, the YTD total was 73,846 at an average of 1,678 Mt per week with an average capacity utilization of 71.6%. Summarizing the YTD year over year, (y/y) improvement: +59,727 tons per week, +2.63 Mt total tons, and +2.6 percentage point increase in the capacity utilization rate.
Figure 2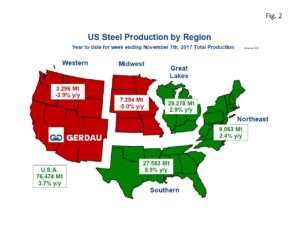 presents a map of the US with the five steel producing zones. The Great Lakes region continued as the largest steel producing region, with 29.28 Mt, YTD, up 2.9% y/y. The Southern region was next with 27.58 Mt YTD up 8.9% y/y. With 9.06 Mt YTD, the Northeast region ranked third largest. The Northeast tonnage increased by 2.4% YTD y/y. The Midwest and Western zones both produced less steel YTD compared to the same timeframe a year ago. The Midwest produced 7.25 Mt YTD, down 5.0% y/y, while the West produced 3.30 Mt YTD down 3.9% y/y.
Examining the production statistics on a 3 month moving total (3MMT), y/y basis, helps smooth out m/m volatility. Nationally the 3MMT was down 0.3% y/y. The Great Lakes was the only region to record positive growth with +3.3%, 3MMT y/y. The Northeast’s’ 3MMT was off 5.9%. The Southern zone recorded a loss of 1.2%, 3MMT y/y. The Midwest tonnage declined by 2.6% while the Western zone saw its production fall by 3.3%, 3MMT y/y.
Momentum defined as 3MMT minus12MMT was flat for the nation at 0.0%. The Northeast and the Southern regions each posted negative momentum of -3.5% and -3.9% respectively. Momentum in the Southern zone has now been negative for eight consecutive weeks. The Great Lakes saw +0.9% momentum, the Midwest +10.4% and the Western zone recorded +4.4% momentum.
The World Steel Association, Short-Range Outlook, (SRO) for apparent steel consumption in 2017 and 2018 was released on October 14th. For NAFTA, (U.S., Canada & Mexico) WSA revised its April SRO from 138.7 Mt to 135.2 Mt a decrease of 3.5 Mt. For 2018, the WSA SRO calls for NAFTA raw steel production to increase to 138.5 Mt, a 2.4% y/y increase over its revised 2017 number. “Steel demand in the developed economies will increase by 0.7 % in 2017 and 1.2 % in 2018”.
At Gerdau, we track US steel production and capacity utilization to keep an eye on the overall health of the US steel industry. We feel it is important to understand the forces that influence steel demand to include the strength of the US economy and import penetration.