

U.S. Steel Capacity Utilization
The total tonnage for the week ending October 21st was 1,731 million tons, (Mt) at a capacity utilization rate of 74.3%. On a four moving average, (4WMA) basis, tonnage output was also 1,731 Mt, at a capacity utilization rate of 74.3%. This week’s 4WMA was 8.4% higher than for the same period last year when the weekly total was 1,596 Mt.
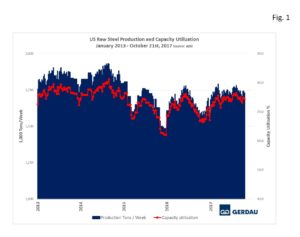 Figure 1 shows production on the left-hand scale and capacity utilization as a percent on the right-hand scale. Production and capacity utilization have been trending higher so far in 2017.
Production year to date, (YTD) was 73,020 Mt, at an average of 1,739 Mt per week with an average capacity utilization of 74.2%. Over the same 42 week period in 2016, the YTD total was 70,674 at an average of 1,683 Mt per week with an average capacity utilization of 71.9%. Summarizing the YTD year over year, (y/y) improvement: +56,000 tons per week, +2.35 Mt total tons, and +2.3 percentage point increase in the capacity utilization rate.
Figure 2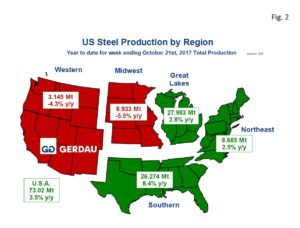 presents a map of the US with the five steel producing zones. The Great Lakes produced the most steel, with 27.98 Mt, YTD, up 2.8% y/y. The Southern region was next with 26.27 Mt YTD up 8.4% y/y. At 8.69 Mt YTD, the Northeast tonnage increased its tonnage by 2.5% YTD y/y. The Midwest and Western zones both produced less steel YTD compared to the same timeframe a year ago. The Midwest produced 6.93 Mt YTD, down 5.5% y/y, while the West produced 3.15 Mt YTD down 4.3% y/y.
The World Steel Association, Short-Range Outlook, (SRO) for apparent steel consumption in 2017 and 2018 was released on October 14th. For NAFTA, (U.S., Canada & Mexico) WSA revised its April SRO from 138.7 Mt to 135.2 Mt a decrease of 3.5 Mt. For 2018, the WSA SRO calls for NAFTA raw steel production to increase to 138.5 Mt, a 2.4% y/y increase over its revised 2017 number.
In its commentary WSA posted the following statement on the developed world; “Benefiting from strong fundamentals, newly announced measures related to fiscal stimuli and rising infrastructure spending, the United States is expected to continue to lead growth in the developed world in 2017-18. However, despite a recovery in oil prices, a rebound of investments in the oil and gas sector may be limited given the increased efficiency of shale producers. The EU recovery is solidifying with many positive developments. Eurozone monetary policy is expected to remain on its current path, at least in 2017, while fiscal tightening is not expected to strengthen further and risk of disinflation has significantly receded. If political stability can be maintained, investment is expected to pick up to provide a further boost to the recovery. Benefiting from the improving global economy and weak yen, Japan’s steel demand is expected to show a stable recovery.”
“Steel demand in the developed economies will increase by 0.7 % in 2017 and 1.2 % in 2018”.
At Gerdau, we track US steel production and capacity utilization to keep an eye on the overall health of the US steel industry. We feel it is important to understand the forces that influence steel demand to include the strength of the US economy and import penetration.