

U.S. Steel Beam Final Imports
Beam final imports to the U.S. were down 19% YoY, and up 34% MoM in March 2019, coming in at 35,035 tons. These include: Angles, Shapes and H Sections, Angles, Shapes and I Sections, Angles H Sections Iron and Non-Alloy Steel Hot-rolled, and Other H Sections.
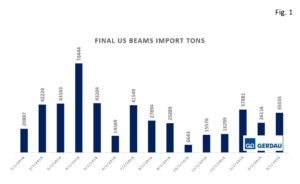 Figure 1 further breaks down total final beam imports from January 2018 – March 2019. When comparing year to date figures from 2018 and 2019, 2019 imports came in at 99,032, down 6.8% from 2018 (106,274 tons) .
Figure 2 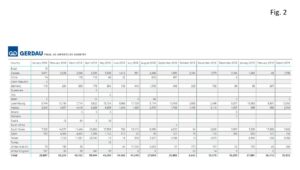 charts the largest exporting countries through January for both 2019 and 2018. Luxembourg was the largest exporter of beams with 12,930 tons in March 2019, up MoM, with 6,801 tons exported in February 2019. Taiwan was the second largest exporter with 9,769. South Korea was the third largest rebar exporter to the US with 7,458. Together these three exporters accounted for 86% of the total.
Laredo, TX port was the largest receiver of U.S. rebar in March 2019, receiving 13,091 tons of the total 35,035. Mobile, AL port was the second largest receiver coming in at 3,755 tons. San Francisco, CA port was the third largest receiver coming in at 3,684 tons. Together, these top three receiving ports collected 59% of all U.S. beam imports
At Gerdau we closely follow trade in long products steel since it has a profound impact on domestic market share and material pricing. We want you, our valued customers to have access to current information that can help you better plan and operate your businesses.