U.S. Steel Beam Final Imports
Beam final imports to the U.S. were down 1.2% year to date (YTD), year on year (y/y), totaling 484,642 tons for the ten months ending October 2017. For the month of October, Beam imports totaled 39,357 tons down 18.8% from the YTD average of 48,464.
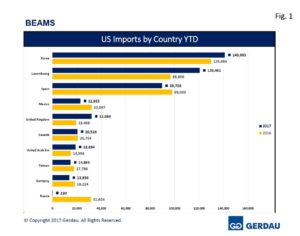
 Figure 1 charts the largest exporting countries in rank order on a YTD basis through October for both 2016 and 2017. Korea was the largest exporter at 140,983 tons to the U.S. YTD, up 8.5% y/y. For the month of October, Korea’s volume was 15,158 tons, 7.5% higher than its YTD average of 14,098 tons. Luxembourg sent 120,461 tons YTD, up 24.7% y/y. For the month of October, Luxembourg’s volume was 3,251 tons 73.0% lower than its YTD average of 12,046 tons. Spain ranked third YTD with 89,736 tons, down 8.5% y/y. For the month of October, Spain’s’ beam exports were 8,325, 7.2% below its YTD average of 8,974 tons. The three country total of Korea, Luxembourg and Spain accounts for 72.5%, (351,180 tons) of YTD U.S. beam imports.
The United Kingdom exported 32,089 tons, surging 64.8% over its YTD 2016 tonnage. Volume in October was 857 tons, 72.4% less than its YTD average of 3,209 tons. Mexico, sent 22,935 tons of beams to the U.S. YTD, down 28.5% y/y. In October, Mexico’s volume was 3,253 tons, 41.8% higher than its 2,294 ton YTD average. Canada was the next largest with 20,516 tons, off 1.1% YTD y/y. Volume for the month of October was 2,321 tons, 13.1% higher than its 2,052 ton YTD average.
The UAE sent 18,894 tons of beams to the U.S. up 26.1% YTD y/y. Shipment volumes have been very erratic ranging from zero tons shipped in February and April and July to 6,252 tons in January. The UAE did not ship any beams to the U.S. in September, but brought-in 2,792 tons in October, 13.1% more than its YTD average. Taiwan shipped 14,863 tons thus far in 2017, down 16.4% YTD y/y. Taiwan did not export any beams in October, its YTD average was 1,486 tons.
Germany exported 13,854 tons through October, down 24.0% YTD y/y. October volume of 306 tons, was 78.9% less than its YTD average tonnage of 1,385 tons. China sent 7,294 tons YTD, up 372% y/y. October beam exports from China surged to 3,035 tons, on the heels of a 2,269 ton shipment in September. China’s YTD average of prior to September was just 194 tons. Brazil rounded out the top ten beam exporters with exported 2,236 tons of beams to the U.S. YTD up 124% y/y. Brazil did not send any tons for the last three months. Its YTD average tonnage through October was 224.
Eight other countries exported a combined total of 881 tons, of beams to the US market YTD 2017. This is substantially lower than the 40,051 tons exported from the same country’s YTD 2016. In 2016 YTD, Russia shipped 31,604 tons of beams to the U.S., while Japan shipped 5,139 tons. Thus far in 2017 Russia shipped 230 tons, while Japan shipped 428 tons.
Houston-Galveston was the largest receiving port, offloading 102,870 tons YTD, up 6.3% YTD y/y. October’s volume was 8,340 tons. Los Angeles held the number two spot with 96,745 tons, down 0.5% YTD y/y. Volume for October came-in at 10,568. Boston ranked third with 43,049 tons up 0.9% YTD y/y. Philadelphia was the next largest port bringing in 32,944 tons YTD, an increase of 3.7% y/y. Mobile received 26,134 tons, down 39.9% YTD y/y. Detroit took in 21,470 tons YTD, a 2.0% y/y increase. San Francisco landed 19,591 tons of U.S. Beams, a 53.9% YTD y/y increase. October beam exports to San Francisco was 3,981 tons. Chicago offloaded 16,918 tons, up 4.8%, YTD y/y. Laredo TX landed 15,602 tons, tumbling 32.0 % YTD y/y. New Orleans, took-in 15,256 tons, a 168% YTD y/y increase. Columbia-Snake OR had just three months of receipts YTD, in March, May and August totaling 14,087 tons, off 26.6% y/y. Duluth unloaded 14,235 tons, up 19.4% YTD y/y.
Eighteen additional ports combined to receive 66,541 tons of beam imports thus far in 2017, 13.7% of the total volume YTD. Beams imports YTD 2016 from the same 18 country’s was 69,516, 14.2% of YTD 2016 volume.
At Gerdau we closely follow trade in long products steel since it has a profound impact on domestic market share and material pricing. We want you, our valued customers to have access to current information that can help you better plan and operate your businesses.

