

U.S. Reinforcing Steel (Rebar) Final Imports
Rebar final imports to the US were down 19.7% year to date (YTD), year on year (y/y), totaling 1,373,282 tons for the nine months ending September 2017. September rebar imports were 28,389 tons, 23.9% lower than the YTD average of 152,587 tons.
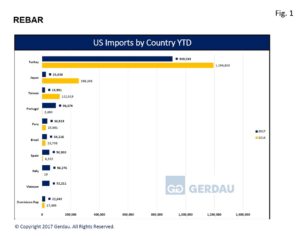 Figure 1 charts the largest exporting countries in rank order on a YTD basis through September for both 2016 and 2017. Turkey is by far the largest exporter at 909,033 tons, down 23.9% YTD y/y. Turkish imports account for 66.2% of the total thus far in 2017, down 3.6 percentage points from the 69.8% recorded YTD 2016.
September’s Turkish imports measured 28,389 tons down 71.8% from its YTD average of 101,004 tons. Portugal was the second largest exporter with 96,074 tons YTD, up from just 2,490 tons YTD 2016. Portugal’s did not export any rebar tons in September. Italy has been an active rebar exporter over the last four months, (zero tons January through May) shipping 56,276 tons YTD up from just 19 tons YTD 2016. Italy’s September shipments surged to 25,269 tons, more than half its YTD total volume. Vietnam sent 52,211 tons YTD, up from zero tons YTD 2016. Vietnam is in and out of the U.S. rebar market, shipping tons in six of the nine months YTD. Vietnam was not active in 2016 YTD. Spain jumped back in the U.S. rebar market with a massive 35,014 ton shipment in September. Its YTD total was 50,900 tons. Spain was not active in 2016 YTD.
Peru ranked sixth largest for rebar exports with a YTD total of 36,519 tons, up 41.1% y/y. Peru has only sent tons to the U.S. in February and June. Brazil brought-in 34,216 tons of rebar to the U.S. market, an increase of 43.8% YTD y/y. Prior to September’s 18,322 ton surge, Brazil was only active in June, (5,553 tons) and July, (10,342 tons). Japan exported 26,634 tons, down 89.6% YTD y/y. Through September of last year, Japan had exported 256,243 tons of rebar to the U.S. Japan has not exported any rebar tons since February of this year. The Dominican Republic with 22,045 tons, was up 26.0% YTD y/y. September tonnage was 1,637 tons, 30.0% less than its 2,449 ton YTD average.
Taiwan sent 19,991 tons of rebar to the U.S. through September of this year, 83.7% less than for the same period last year. Taiwan exported zero tons in both August and September, after sending 9,558 tons in July. Taiwan has only exported rebar tons in three of the nine months thus far this year. Russia’s rebar export total was 16,395 tons YTD. All of it shipped in August. Year to date last year Russian shipments totaled 22,129 tons. Canada exported 15,836 tons YTD, a 43.2% y/y increase. September exports were 723 tons, 58.9% below its 1,760 ton YTD average.
There were 16 additional countries that exported rebar to the US thus far in 2017. The combined total was 37,153 tons or 2.7% of the total. The 18 country total for September was 12,927 tons including an 8,510 ton shipment from Columbia, its first this year, Columbia did not ship any tons in 2016.
Houston/Galveston was the port that took in the most tons, (38.0% of total shipments YTD) with 521,857, down 14.4% YTD y/y. New Orleans offloaded 233,007 tons YTD, off 15.3% y/y. New Orleans did not take-in any tons in September. Philadelphia held the number three spot with 160,192 tons, gaining 4.2% YTD y/y. Miami was the next largest port bringing in 154,187 tons YTD, down 37.7% y/y. Boston ranked 5th largest YTD in 2017 bringing in 60,999 tons, up 76.4%, y/y. Tampa saw a 21.2% YTD y/y increase, receiving 58,155 tons. Tampa did not receive any tons in either August or September. San Juan PR offloaded 51,316 tons, a decrease of 11.5%, YTD y/y.
San Francisco took-in 44,411 tons YTD, down 65.1% y/y. Baltimore was next with 32,622 tons, falling 21.8% YTD y/y. Baltimore has not taken-in any tons since July. Los Angeles ranked 10th with 23,491 tons, plummeting 71.8% YTD y/y. Los Angeles has not taken-in any tons since July.
Seventeen additional ports combined to offload 33,044 tons of rebar YTD 2017, 2.4% of total rebar imports. 30.3% more than the 25,358 tons YTD 2016.
At Gerdau we closely follow trade in long products steel since it has a profound impact on domestic market share and material pricing. We want you, our valued customers to have access to current information that can help you better plan and operate your businesses.