

U.S. Reinforcing Steel (Rebar) Final Imports
Rebar final imports to the US were up 0.7% year to date (YTD), year on year (y/y), totaling 1,036,049 tons for the six months ending June 2017. On a month over month, (m/m), comparison, rebar imports soared by 65.4% to 135,411.
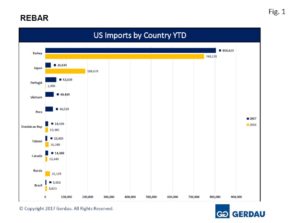 Figure 1 charts the largest exporting countries in rank order on a YTD basis through June for both 2016 and 2017. Turkey is by far the largest exporter at 804,623 tons, up 7.5% YTD y/y. Turkish imports account for 77.7% of the total thus far in 2017, up from, 72.7% YTD 2016. Month on month Turkish rebar exports surged 65.4% to 135,411 tons. Portugal jumped into 2nd place with 52,629 tons YTD from just 2,490 tons YTD 2016. Portugal’s’ shipment volume is very erratic. It shipped zero tons in January and May, 16,033 tons in March, 1,478 tons in April and 35,118 tons in June. Vietnam is a new entrant with 40,449 tons YTD, up from zero tons YTD 2016. Vietnam also exhibits an erratic export pattern. It shipped zero tons in January and June, 5,571 tons in February, 12,401 tons in March, 2,399 tons on April and 20,777 tons in May. Japan fell to 4th largest with 26,634 tons, down 85.9% YTD y/y. Through June of last year, Japan had exported 188,670 tons of rebar to the US YTD 2016. Japan has not exported any rebar tons since February of this year. Canadian rebar exports increased by 38.7% YTD y/y to 14,488 tons. After two month 400 ton months in a row, June exports moved-up to 1,068 tons. The 7th largest YTD exporter was the Dominican Republic with 14,339 tons, up 7.1% YTD y/y. Month on month volume nearly doubled rising from 1,715 tons in May to 3,232 tons in June.
There were 18 additional countries that exported rebar to the US thus far in 2017. The combined total was 46,368 tons or 4.5%.
Houston/Galveston was the port that took in the most tons, 357,476, down 6.5% YTD y/y, followed by New Orleans offloading 217,146 tons YTD, up 11.7% YTD y/y. Philadelphia held the number three spot with 142,770 tons, ballooning 148% YTD y/y. Miami was the next largest port bringing in 116,987 tons YTD, down 28.3% YTD y/y. Tampa saw a 144% YTD y/y increase receiving 53,422 tons. Boston was the sixth largest port YTD in 2017 bringing in 38,227 tons, up 74.5%, YTD y/y. San Juan PR took-in 37,122 tons, off 1.9%, YTD y/y. Baltimore was next with 22,725 tons, surging 37.6% YTD y/y. San Francisco and Los Angeles ranked 9th and 10th with 20,902 tons, down 67.7% YTD y/y and 17,011 tons, down 39.6% YTD y/y respectfully.
At Gerdau we closely follow trade in long products steel since it has a profound impact on domestic market share and material pricing. We want you, our valued customers to have access to current information that can help you better plan and operate your businesses.