

U.S. Manufacturing Capacity Utilization
Manufacturing capacity utilization (MCU), scored a 75.7% in May, up 0.08% month on month, (m/m), its first monthly increase since January. On a year on year (y/y) comparison the MCU was a modest 0.8%.
Manufacturing fundamentals continue to improve. Both the U.S. and global economy are strengthening and at the same time, the dollar has depreciated against the Broad Index, (basket of countries’ currencies that the U.S trades with). In addition, inventories that were previously seen as a drag on production have now shifted to a supporting role.
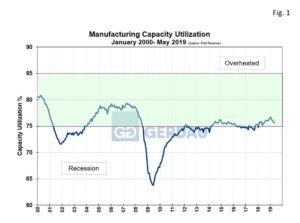 Figure 1, charts capacity utilization from 2000 to present. The MCU index is currently in the green zone which is considered to be ideal. After a long run at the bottom of the “green zone”, the index has begun to move higher scoring its second month in a row above 76%.
The Institute of Supply Management’s Index moved down 0.7 points on month, (m/m) to 52.1 for May 2019. This value is an encouraging sign for the manufacturing sector. The index has been greater than 50, (>50 = expansion) for thirty-three consecutive months. While the non-manufacturing composite index increased by 1.4 points month on month, (+2.5 %m/m) to 56.9 in May. The indexes remain strong in 2019, down 2.9% 12MMA y/y.
At Gerdau we regularly monitor the manufacturing capacity utilization date issued by the Federal Reserve because it provides excellent insight into the health of US manufacturing activity. We know that when manufacturing is performing well, so are steel sales and want to keep you our valued customers and readers informed.