

U.S. Manufacturing Capacity Utilization
Manufacturing capacity utilization advanced by 0.9 index points to reach its highest level since June 2008. Capacity utilization for manufacturing was 76.4% in October, a rate that is 2.0 percentage points below its long-run average. Utilization for durables increased 0.2 percentage point to 75.7%, while the rate for nondurables rose 1.7 percentage points to 78.1%. The operating rate for mines fell 1.3 percentage points to 82.4%, and the rate for utilities rose 1.5 percentage points to 77.2%.
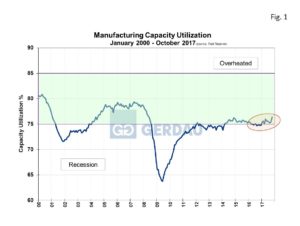 Figure 1, charts capacity utilization from 2010 to present. The manufacturing capacity utilization index is currently in the green zone which is considered to be ideal. The indexes October score showed its first meaningful break-out since early 2014.
The Industrial production index rose 0.9% in October while manufacturing increased 1.3%. Industrial activity returned to normal operations after Hurricanes Harvey and Irma curbed production in August and September. Manufacturing fundamentals continue to improve. Both the U.S. and global economy are strengthening and at the same time and the dollar has depreciated against the Broad Index., Inventories that were long considered a drag on production are now providing support. Total industrial production was up 2.9% year on year, (y/y). October’s score was 106.1 percent of its 2012 average. Capacity utilization for the industrial sector was 77.0%, a rate that is 2.9 percentage points below its long-run (1972–2016) average.
Within the market groups of interest to steel producers/consumers, construction supplies recorded a gain of 0.4%. The production of materials rose 1.3% despite a small decline in energy materials; all major components of both durable and nondurable materials posted gains for the month. Especially noteworthy were chemical materials which surged by 12.3%, as factories shuttered by Hurricane Harvey returned to normal operations.
Examining industry groups, manufacturing output rose 1.3% in October. The durables index increased 0.4%, as the nondurables index increased 2.3%. Most durable goods industries posted gains. Motor vehicles and parts posted the largest increase, up 1.0% m/m. Gains were widespread among nondurable goods producers after the return to normal levels of production following the hurricanes.
At Gerdau we regularly monitor the manufacturing capacity utilization date issued by the Federal Reserve because it provides excellent insight into the health of US manufacturing activity. We know that when manufacturing is performing well, so are steel sales and want to keep you our valued customers and readers informed.