

U.S. Manufacturing Capacity Utilization
Manufacturing capacity utilization (MCU), scored a 75.1% in September, flat month on month, (m/m). On a year on year (y/y) comparison MCU was up 0.7%. According to the Federal Reserve, the current rate of MCU is 3.3 percentage points below its long term average. The aftermath of hurricane Harvey continued to impact the production of chemical materials which were down 7.2% m/m and negatively influencing the entire index. Construction supplies recorded a gain of 1.9% m/m.
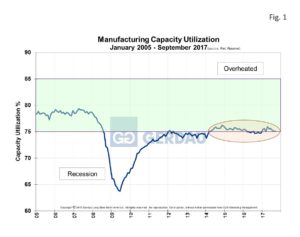 Figure 1, charts capacity utilization from 2010 to present. The MCU index is currently in the green zone which is considered to be ideal. However, the MCU is at the bottom of the “green zone” where it has languished for five plus years.
Figure 2 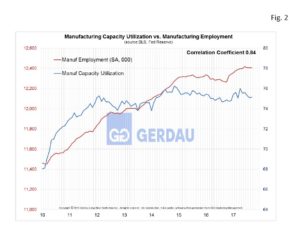 shows MCU overlaid with manufacturing employment. Not surprisingly the two data sets are highly correlated. What is interesting is that employment was held down, (below the blue line) in the three years after the recession ended. When MCU hit the 75% range early in 2014, employment rose above the blue line and has since remained above the line. Manufacturing employment is now at its highest point since before the recession. Figure 3 shows the same chart as in Figure 2 but with
 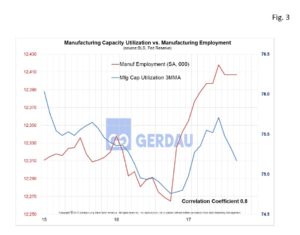 exaggerated Y axis scales for the period between 2015 and present. This shows that manufacturing employment has accelerated in recent months as businesses anticipate stronger orders.
The ISM manufacturing index recorded a value of 60.8 for September, with new orders at 64.6 and production at 62.2. All numbers were solidly in the expansion zone and at its highest level since 2004. In addition, the industrial production index rose 0.3% in September, (after falling in August as a function of hurricanes Harvey and Irma) pointing to continued growth going forward.
Manufacturing fundamentals continue to improve. Both the U.S. and global economy are strengthening and at the same time, the dollar has depreciated against the Broad Index, (basket of countries’ currencies that the U.S trades with). In addition, inventories that were previously seen as a drag on production have now shifted to a supporting role.
At Gerdau we regularly monitor the manufacturing capacity utilization date issued by the Federal Reserve because it provides excellent insight into the health of US manufacturing activity. We know that when manufacturing is performing well, so are steel sales and want to keep you our valued customers and readers informed.