U.S. Manufacturing Capacity Utilization
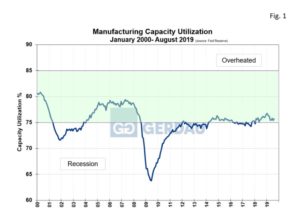
Manufacturing capacity utilization (MCU), scored a 75.7% in August, up 0.4% month on month (m/m), and down 0.4% year on year (y/y)
 Figure 1 charts capacity utilization from 2000 to present. The MCU index is currently in the green zone which is considered to be ideal. After a long run at the bottom of the “green zone”, the index has begun to move higher scoring its second month in a row above 76%.
U.S. manufacturing output increased more than expected in August, boosted by a surge in machinery and primary metals production. The outlook for factories remains weak, however, against the backdrop of trade tensions and slowing global economies
The Institute of Supply Management’s Index moved down 2.1 points on month, (m/m) to 49.1 for August 2019. This is the first time the index has been lower than 50 since August 2016. Before this month, the index had been greater than 50, (>50 = expansion) for thirty-five consecutive months. The new orders sub-index scored a 47.2. Overall, the ISM manufacturing index is weakening.
Of the 18 manufacturing industries, nine reported growth in August, in the following order: Textile Mills; Furniture & Related Products; Food, Beverage & Tobacco Products; Wood Products; Petroleum & Coal Products; Nonmetallic Mineral Products; Machinery; Miscellaneous Manufacturing; and Chemical Products. The seven industries reporting contraction in August — in the following order — are: Apparel, Leather & Allied Products; Fabricated Metal Products; Transportation Equipment; Primary Metals; Plastics & Rubber Products; Paper Products; and Electrical Equipment, Appliances & Components.
At Gerdau we regularly monitor the manufacturing capacity utilization date issued by the Federal Reserve because it provides excellent insight into the health of US manufacturing activity. We know that when manufacturing is performing well, so are steel sales and want to keep you our valued customers and readers informed.

