

U.S. Manufacturing Capacity Utilization
Manufacturing capacity utilization (MCU), came in at 75.4% in June, flat month on month (m/m), up 0.3 percentage point year on year (y/y). Year to date (YTD), MCU has stayed in a very narrow range (75.3 to 75.7%), averaging 75.4%.
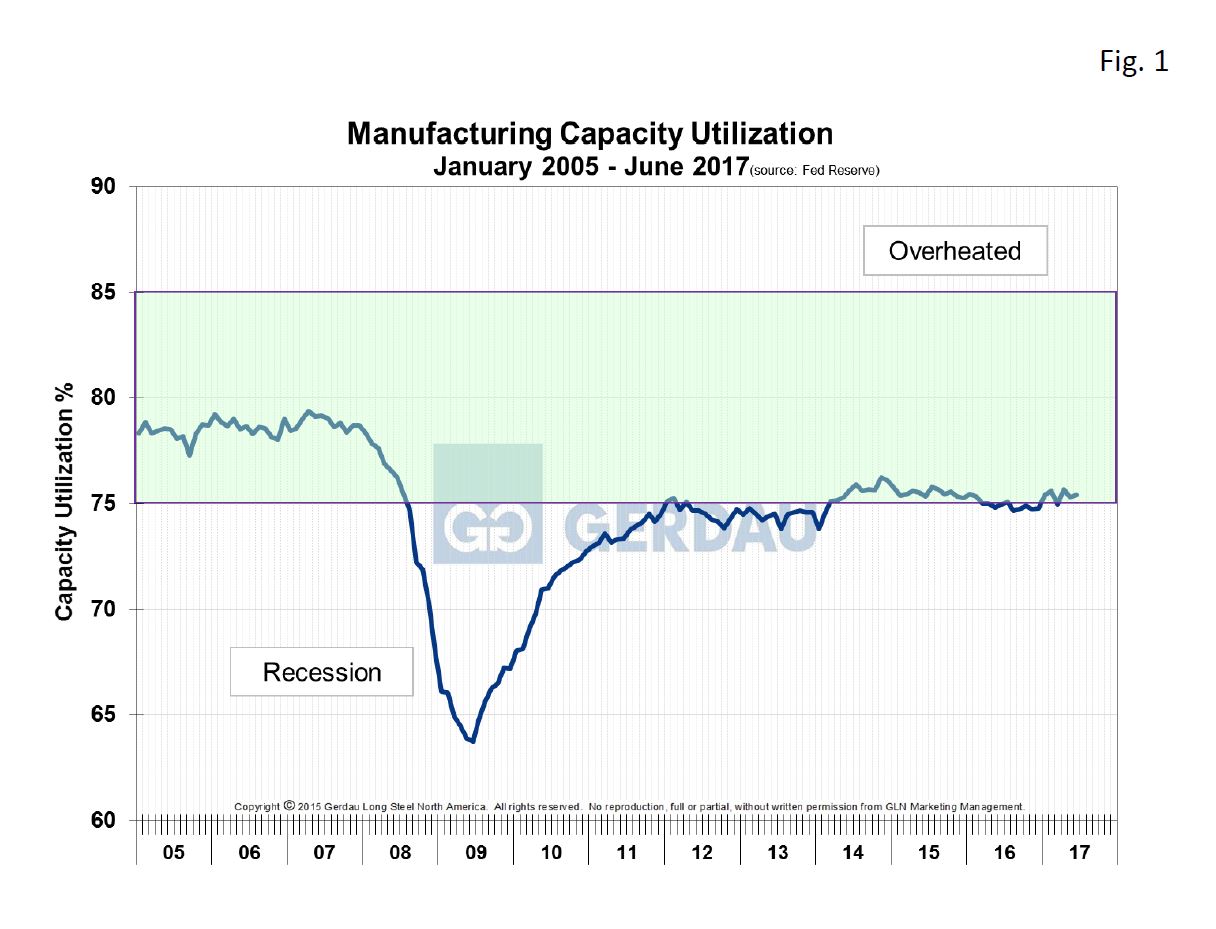 Figure 1, charts capacity utilization from 2010 to present. It has progressed in a very narrow range from mid-2011 through June 2017, but has moved-up slightly thus far in 2017.
Figure 2 shows the same data in Figure 1 back to the year 2000 with the addition of MSCI service (all carbon products), center shipment data on the right-hand Y axis in red. Long products is broken out from all carbon products (green line). In the period between 2000 and 2008, MCU was in the 80 to 85% range. Since 2011, the MCU has been range bound between 73 to 76%, averaging 74.8%.
The all carbon product shipment data and MCU were correlated with a coefficient 0.704, a meaningful relationship. Long products MSCI shipments on the other hand only correlates to MCU with a coefficient of 0.502. Not a very significant relationship. The reason being that a large ratio of long products finds its way into construction projects.
The ISM manufacturing index hit it its highest level in June since August 2014 and the sub-indexes within the composite were largely upbeat. However despite the robust ISM report, employment levels have been stagnant. The average 2017 YTD manufacturing employment total was 12.355 million, just 8,000 or 0.06% more than the 2016 YTD average.
On a positive note, the US dollar (USD) has fallen for six consecutive months against the Broad Index, (a trade weighted basket of currencies). The June 2017 Broad index value was 97.77, down 1.3% from the May’s reading and down 2.8% compared to 3 months ago. The Euro hit a two year high against the dollar today, (1.1628 EUR/USD). A lower dollar should help U.S. manufacturers increase export sales.
At Gerdau we regularly monitor the manufacturing capacity utilization date issued by the Federal Reserve because it provides excellent insight into the health of US manufacturing activity. We know that when manufacturing is performing well, so are steel sales and want to keep you our valued customers and readers informed.