

U.S. Manufacturing Capacity Utilization
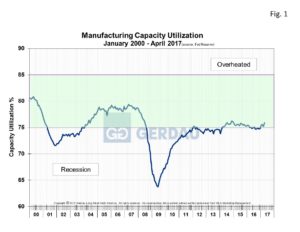 Manufacturing capacity utilization (CU), bounced back to 75.90 in April, after a slight decline in March, up 0.94% month on month (m/m) and up 1.17% year on year (y/y). The 20 year average CU rate was 75.74, nearly exactly the current three month moving average (3MMA).
Figure 1, charts capacity utilization from 2010 to present. It has progressed in a very narrow range from middle of 2011 through April 2017, but has started to make a positive move this far in 2017.
Figure 2 shows the same data in Figure 1 back to the year 2000 with the addition of MSCI service (all carbon products), center shipment data on the right-hand Y axis in red. Long products is broken out from all carbon products (green line). In the period between 2000 and 2008, CU was in the 0.80 to 0.85 range. Since 2010, the CU has been range bound from 0.68 to 0.76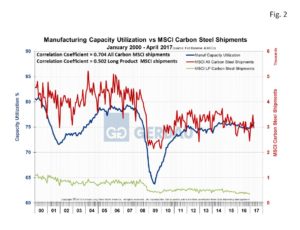
The all carbon product shipment data and manufacturing CU were correlated with a coefficient 0.704, a meaningful relationship. Long products MSCI shipments on the other hand only correlates to manufacturing CU with a coefficient of 0.502. Not a very significant relationship. The reason being that a large ratio of long products finds its way into construction projects.
Yesterday’s Federal Reserve report on US manufacturing showed that Aprils’ 1% increase in manufacturing production was the largest increase since February 2014 and much better than analysts had expected. The most recent manufacturing ISM survey index 3MMA was 56.6 in April, up a solid six points from the same period last year. This indicates that manufacturers are seeing a brighter future. Proposed regulation reform and lower corporate tax structure are the primary reasons. Consumer confidence is also at multi-year highs. However, the strong dollar continues to be a headwind for exporters. The US trade balance 3MMA was -$67,582.3 million for the first quarter, up 7,000.6 million from last years -$60,851.7 million.
At Gerdau we regularly monitor the manufacturing capacity utilization date issued by the Federal Reserve because it provides excellent insight into the health of US manufacturing activity. We know that when manufacturing is performing well, so are steel sales and want to keep you our valued customers and readers informed.