

U.S. Manufacturing Capacity Utilization
The manufacturing index moved up for the third consecutive month reaching 75.3897 in February. This places in just inside the desirable range of between 75 and 85. Greater than 85 is considered to be overheated, while less than 75 is in the recessionary zone. Growth in the index is up 0.42% month on month but was flat year on year at +0.04%. Despite these advances, the index remains 2.8 points below its long term average
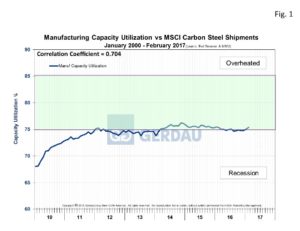 Figure 1, charts capacity utilization from 2010 to present. It has moved in a very narrow range from middle of 2011 through February 2017. The hopeful news is that the last few monthly readings have slowly but steadily increased. Referencing commentary from the Federal Reserve, within specific market groups: Most of the major non-energy market groups recorded increases in February. Of particular interest is the output of construction supplies jumped 1.3% the index has advanced more than 4% over the past six months. The indexes for non-energy business supplies and non-energy materials each rose more than 0.5%. Within materials, both durable and non-durable materials posted gains.
Referencing Industry Groups: Manufacturing output rose 0.5% in February for a second consecutive month. Led by advances of more than 1% for nonmetallic mineral products, fabricated metal products, and machinery, the production of durables increased 0.6%. The output of mining jumped 2.7% in February, with widespread gains among its components, after moving up 2.2% in January. The mining index in February was 1.8% higher than its year-earlier level.
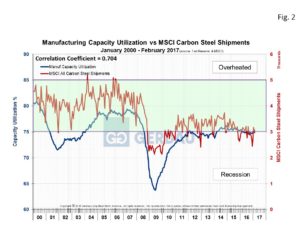 Figure 2 shows the same data in Figure 1 back to the year 2000 with the addition of MSCI service center shipment data on the right-hand Y axis in red. The two data sets are correlated (coefficient 0.704), as you would expect, however we observe a “step change” between the pre-recession and post-recession periods. In the earlier period when capacity utilization was in the 80 to 85 range. The red line was higher than the blue line. In the post-recession period the two lines are much closer together. We think this is because businesses are more willing to carry surplus inventory when the capacity utilization rates are high because the risk is lower.
At Gerdau we regularly monitor the manufacturing capacity utilization date issued by the Federal Reserve because it provides excellent insight into the health of US manufacturing activity. We know that when manufacturing is performing well, so are steel sales and want to keep you our valued customers and readers informed.