

U.S. Inventory Census Report
Total seasonally adjusted (SA), inflation adjusted manufacturing inventories totaled $576,651 million (M) at the end of April, down 0.80% month on month (m/m), but up 0.46% year on year, (y/y).The total manufacturing inventories to shipment ratio (I/S), was 1.38 flat m/m and up 0.03 points y/y.
The US Census Bureau issues a report on inventory levels of manufactured goods. The time series data is presented in both seasonally adjusted (SA), non-inflation adjusted dollars and inflation adjusted dollars. The inflation adjustment is made by using the Census Bureau’s producer price index (PPI), series for each of its nine categories.
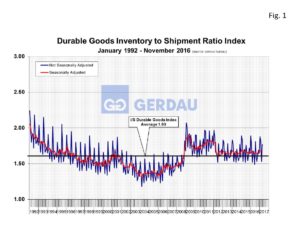 Figure 1 presents the I/S ratio for durable goods inventory in both SA and NSA format for, 1992 to present. The SA I/S was 1.69 in April. It has been within 0.1 points of this value for the last five months. The ratio averaged 1.66 for the first four months of 2016. A smaller ratio results in higher inventory turns and a faster cash to cash cycle. The I/S ratio came steadily down throughout the 1990s and early 2000s. Information technology and higher productivity get most of the credit for this improvement. When the recession hit the I/S ratio jumped as consumers cut their spending and inventories climbed ad layoffs ensued. In March 2012 the I/S corrected falling 1.97 in January to 1.66 in March. Since then it has been in a narrow range between 1.61 and 1.69.
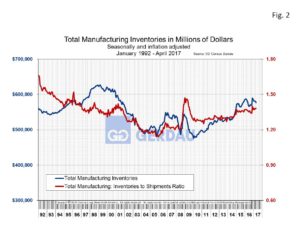 Figure 2 examines manufacturing inventories from 1992 to present, (blue line, left-hand Y axis), and it’s I/S ratio (red line, right-hand Y axis). So far in 2017, inventory levels are climbing modestly, while at the same time the I/S ratio is falling. It is a sign of confidence for the manufacturing sector when the blue line is higher than the red line as it the present-day case.
Total SA and inflation adjusted manufacturing inventories were valued at $576,651M at the end of April. Motor vehicles and parts SA and inflation adjusted inventories were $30,995M or 5.38% of this. Figure 3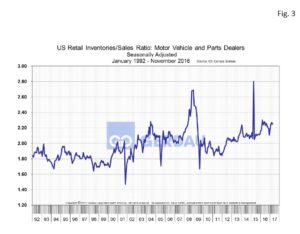 shows SA and inflation adjusted retail I/S ratio of vehicles and parts from 1992 to present. The I/S ratio was 2.25 in April, flat (within + or - 0.01), m/m and y/y, but generally trending higher. Data from Ward’s automotive supports this, reporting that days-supply in May was 68, up 9 days y/y. Sales through May were $6.938M down 2.0% y/y.
Iron and steel mill inventories (includes ferroalloys & steel products manufacturing), totaled $16,732M in April, up 1.6% m/m but were down 6.8% y/y.