U.S. Infrastructure Spending
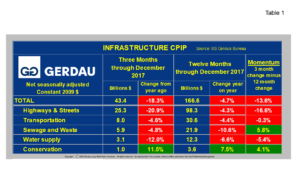
Referencing data from the U.S. Census Bureau’s construction put-in-place (CPIP) shows that infrastructure spending, (not seasonally adjusted in constant 2009 dollars) decreased by 1.1%, 12 months year on year, (y/y) to $166.6 billion, (B). On a three month y/y comparison, spending was down 14.9% to $43.4. Momentum, (3 month change minus 12 month change) was negative 13.8%.
 Table 1 presents three month y/y and 12 month y/y data in NSA, constant dollars as well as the percentage change over these two intervals. Spending was down in every category on a 12 month y/y basis except for the smallest outlay category, conservation. Conservation recorded growth for both 3 and 12 month y/y comparisons. Conservation spending was higher by 11.5% on a 3MMA basis and up by 7.5% on a 12MMA comparison. Momentum was +4.1% on the stronger 3 month expenditure.
By far the largest expenditure category, Highways and streets which includes paving and bridges accounted for 57% of total infrastructure spending over the last 12 months. Spending was down 4.3%, 12 months y/y and a much larger 20.9%, 3 months y/y. As a result, momentum for Highways and streets was negative 16.6%.
The second largest spend was for Transportation. It was negative 4.4% on a 12 month y/y basis and negative 4.6% on a 3 month y/y comparison. Sewage & Waste spending fell 10.6% over 12 months and also recorded a negative 4.8% over 3 months. In an encouraging sign, the resultant momentum was positive 5.8%. Water supply was lower by 6.6% for 3 months y/y and down by 12.0% on a 12 month y/y basis. Thus momentum was negative 5.4%.
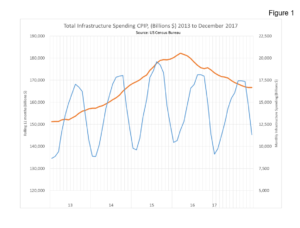
Figure 1 plots total infrastructure spending from 2013 to present on both a monthly and on a 12 month rolling basis. The orange line, (12 month rolling expenditures) clearly illustrates that aggregate spending on infrastructure is trending in sharply downward. On a rolling 12 month basis, spending peaked in March 2016 at $182.2B. The December 2017 rolling 12 month infrastructure spending was $166.6B, down $15.6B or -8.6% from the recent peak level.
The American Society of Civil Engineers, (ASCE) 2017 infrastructure report for America scored an overall “D+”. The best score was for Railroads with a “B”. The worst score was for Transit at “D-“. Airports, Dams, Drinking water, Inland waterways, Levees, and Roads all scored a “D”. Energy, Hazardous waste, Public parks, Schools and Wastewater all scored a “D+”. Bridges, Ports, Solid waste all scored a “C+”. Clearly there is a need for significant infrastructure spending in this country.
President Trump unveiled his long awaited infrastructure plan on Monday. The 53 page documents lays out his vision to turn $200B in federal money into $1.5 Trillion for fixing America’s infrastructure by leveraging local and state tax dollars and private investment. The plan only commits $200B of direct federal spending with the balance to come from state and local governments. State and local governments are expected to match any federal allocation by a four-to-one ratio. The plan includes a “look-back” provision so that state and local governments are not penalized for forward thinking. Another big initiative in the plan calls for shortening the current lengthy permitting process to receive federal funds. The goal is to reduce the timeline from five to ten years, down to two years.
At Gerdau, we regularly monitor spending on infrastructure since it has a huge impact on steel sales, particularly long products, which we produce and market to you our valued customers.

