U.S. Infrastructure Spending
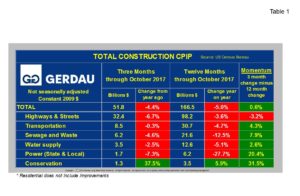
Referencing data from the U.S. Census Bureau’s construction put-in-place (CPIP) shows that total infrastructure spending, (not seasonally adjusted in constant 2009 dollars) decreased by 4.4% three months year on year, (y/y) to $51.8 billion, (B). On a twelve month y/y comparison, spending was down 5.0% to $166.5. Momentum was positive at 0.6%.
 Table 1 presents three month y/y and 12 month y/y data in NSA, constant dollars as well as the percentage change over these two intervals. The column to the far right list momentum which we define as 3 months minus 12 months.
Spending was down in every category for both 3 and 12 month y/y comparisons except for the smallest outlay category, conservation. Conservation recorded growth for both 3 and 12 month y/y comparisons. Conservation spending was higher by 37.5% on a 3MMA basis and up by 5.9% on a 12MMA comparison. Momentum surged to +31.5% on the stronger 3 month expenditure. Highways and streets which includes paving and bridges accounted for 59% of total infrastructure spending over the last 12 months. Spending was down 3.6%, 12 months y/y and a much larger 6.7%, 3 months y/y. As a result, momentum for Highways and streets was negative 3.2%. The second largest spend was for Transportation. It was off 4.7% on a 12 month y/y basis and a much smaller 0.3% on a 3 month y/y comparison resulting in positive momentum of 4.3%. Sewage & Waste spending fell 12.5% over 12 months and -4.6% over 3 months. The resultant momentum was +7.9%. Water supply was lower by 5.1% for 3 months and down by 2.5% on a 12 month y/y basis.
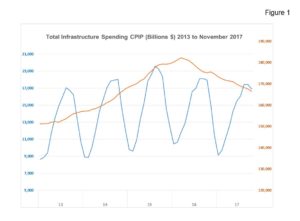
Figure 1  plots total infrastructure spending from 2013 to present on both a monthly and on a 12 month rolling basis. The orange line, (12 month rolling expenditures) clearly illustrates that aggregate spending on infrastructure is trending in sharply downward. On a rolling 12 month basis, spending peaked in March 2016 at $182.2B. October 2017 rolling 12 month infrastructure spending was $166.5B, down $15.2B or -8.6% from the recent peak level.
The Federal Highway Administration website; www.fhwa.dot.gov/fastact/funding.cfm presents spending allocation tables by state by year and one would conclude from this that the money is indeed flowing to the states. Yet the total infrastructure spend from the U.S. Census Bureau’s CPIP report shows a continuous decline over the past two years.
The Portland Cement Association, (PCA) has adjusted downward its cement consumption forecast projections for 2017 and 2018. “While our macroeconomic, and much of our construction spending projections remain on target, weather and weakness in the public construction sector have prompted the adoption of a more modest growth outlook”. Referencing a comment from Mr. Ed Sullivan, PCA senior vice president: “Once infrastructure and tax reform initiatives take hold and affect economic and construction activity, then we can expect growth in cement consumption to accelerate to higher levels.
At Gerdau, we regularly monitor spending on infrastructure since it has a huge impact on steel sales, particularly long products, which we produce and market to you our valued customers.

