U.S. Infrastructure Spending
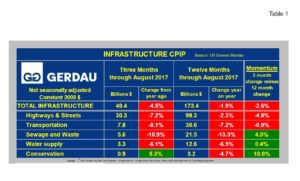
Referencing data from the U.S. Census Bureau’s construction put-in-place (CPIP) shows that total infrastructure spending, (not seasonally adjusted in constant 2009 dollars) decreased by 4.5% three months year on year, (y/y) to $49.4 billion, (B). On a twelve month y/y comparison, spending was down 1.9% to $173.4B resulting in negative 2.6% momentum.
 Table 1 presents three month y/y and 12 month y/y data in NSA, constant dollars as well as the percentage change over these two intervals. The column to the far right list momentum which we define as 3 months minus 12 months. Spending is down in every category for both 3 and 12 month y/y comparisons except Conservation which was higher by 5.3% on a 3MMA basis, but down by 4.7% on a 12MMA comparison.
Highways and streets which includes paving and bridges accounted for 57% of total infrastructure spending. Spending was down 2.3%, 12 months y/y and a much larger 7.2%, 3 months y/y. As a result, momentum for Highways and streets was -4.9%.
The second largest spend was for Transportation. It was off 8.1% on a 12 month y/y basis and -7.2% on a 3 month y/y comparison resulting in negative momentum of 0.9%. Sewage & waste fell 15.3% over 12 months and -10.9% over 3 months. Water supply spending was also lower, falling 6.5% on a 12 month y/y basis and by 6.1% when looked at on a 3 month y/y comparison. The good news is that 3 project categories posted positive momentum to include: Sewage & Waste, +4.5%, Water Supply, +0.4% and Conservation, +10%.
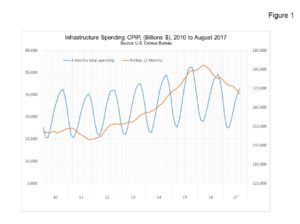
Figure 1 plots total infrastructure spending from 2010 to present on both a monthly and on a 12 month rolling basis. The orange line, (12 month rolling expenditures) clearly illustrates that aggregate spending on infrastructure is trending in the wrong direction. On a rolling 12 month basis, spending peaked in March 2016 at $182.2B. August infrastructure spending was $167.1B, down $15.1B or -8.3% from the recent peak level.
We are yet to see any sign that spending has commenced from the five year, $305 billion transportation bill, (FAST Act = Fixing America’s Surface Transportation) authorized in December 2015 by Congress to fund roads, bridges and rail lines. History has shown that the approval process is long, however we would have expected to see some of this money flowing by this point, 32 months after the legislation was passed into law. Googling; “$305 billion transportation bill spending to date”, does not bring up a single article. In fact, there does not appear to be anything published on a simple Goggle search on the subject since the signing. A visit to the Federal Highway Administration website; www.fhwa.dot.gov/fastact/funding.cfm presents spending allocation tables by state by year and one would conclude from this that the money is flowing. Yet the total infrastructure spend from the U.S. Census Bureau’s CPIP report shows a sharp y/y decline over the past two years, so there must be more to the story. We will keep digging into this important subject and pass on our findings in future issues as the story unfolds.
At Gerdau, we regularly monitor spending on infrastructure since it has a huge impact on steel sales, particularly long products, which we produce and market to you our valued customers.

