U.S. Infrastructure
Every four years, the American Society of Civil Engineers (ASCE) issues a report card on the health of infrastructure in America. The full 2017 detailed report is not yet available but the overall score was D+ on an A to F scale, the same score as the previous report.
Referencing the ASCE report card; Members of ASCE advisory council assign grades according to the following eight criteria: capacity, condition, funding, future need, operation and maintenance, public safety, resilience, and innovation. The grades have been near failing since 1998, averaging only Ds, due to delayed maintenance and under-investment across most categories.
The ASCE estimates that an investment of $3.6 Trillion (T), is required to bring our infrastructure to standard. According to ASCE, not having a competitive infrastructure costs the economy $3.9 T annually to our GDP which is equal to the total of Germany.
There are 16 categories that make up the overall score. It is important to point out that the individual categories are integrated. For example, an excellent wastewater treatment facility would not function effectively without a stable electrical grid. In its 2013 report just four categories scored better than a C- on the A to F scale. These include: Public Parks & Recreation, Bridges, Ports and Rail. The remaining categories all scored a D+, D or D-. These include: Energy, Roads, Wastewater, Levees, Drinking Water, Schools, Transit, Inland Waterways, Aviation, Hazardous Waste and Dams.
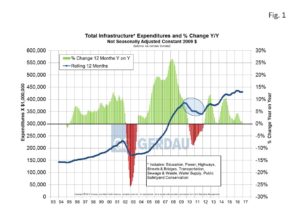
 Figure 1 presents non-seasonally adjusted constant 2009 dollar construction put-in-place (CPIP), data from the US Census Bureau from 2009 to present for total infrastructure spending. To match-up with the ASCE definition of infrastructure this chart includes: Highways, Streets & Bridges, Transportation, Sewage & Waste, Water Supply, and Conservation. After the 2001, 2002 recession spending ramped up nicely in the years 2005 through 2009. The great recession saw spending levels plummet for two years through early 2013, (inset blue tinted circle). Spending levels have picked-up since then but not at anywhere near the same rate as after the 2001, 2002 recession.
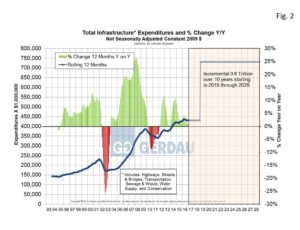
In ASCEs report card it suggests a $3.6 T incremental spending in infrastructure is required to return to a compliant level. To get a sense of what this looks like in Figure 2  we plot an incremental $3.6 T over a 10 year period starting in 2019 and running at a constant rate through 2029. We assume a constant 2016 rate of spending in for 2017 and 2018, leaving time for an infrastructure bill to be passed through Congress and flow into spending on projects. It is highly unlikely that a bill of this size would be approved. The number of $1 T has been mentioned by then candidate and now president Trump as a starting point for lawmakers to consider. We desperately need to improve our crumbling infrastructure, and an increment spend $1 T would be a good start.
At Gerdau, we regularly monitor spending on infrastructure since it has a huge impact on steel sales, particularly long products, which we produce and market to you our valued customers.

