

US Industrial Production & Mfg Capacity Utilization
This data is from the Federal Reserve and is seasonally adjusted. The index is based on the May 2012 level being defined as 100. The Industrial Production Index had an all-time high of 106.70 in November 2014 and had trended down until June this year when it reversed the slide and began a gradual rebound, (Figure 1)
[caption id="attachment_1058" align="alignleft" width="500"]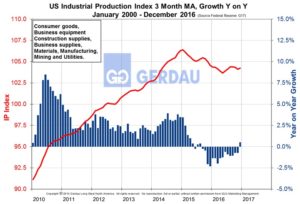 Figure 1[/caption]
. The three month moving average, (3MMA) came in at 104.23 in December range-bound since July 2016. Year on year percentage change was a negative 1.0%. The y/y change posted its first positive value (+0.5%) after a string of 13 months of declines. Hopefully this is the beginning of a turn-a-round for manufacturing that has struggled to gain ground since peaking in January 2015.
Capacity utilization for the industrial sector increased 0.6 of a point in December to 75.5%, a rate that is 4.5 percentage points below its long-run (1972–2015) average. The specific sub-category capacity utilization figure for manufacturing was a shade lower at 74.8% in December. Service center all carbon steel shipments are correlated (0.74) to manufacturing capacity utilization, however breaking-out just long product carbon steel shipments, the correlation falls to just 0.502, Figure 2. This makes sense since we know that a high ratio of long products are consumed in construction projects.