

U.S. Industrial Production
Industrial production moved-up 0.2% in November, month on month, (m/m) a bit shy of analyst’s consensus forecast, but its third consecutive monthly increase. Overall capacity utilization as well as manufacturing each gained 0.1 percentage point for the month. Another encouraging note was that the top line for October was revised up from 0.9% to 1.2%. Production is now 3.4% higher over that last year.
Industrial production is a pure measure of output, untainted by the effects of price swings, in the industrial part of the U.S. economy. Every month, the Federal Reserve calculates an index of industrial production after collecting data on 312 industry components representing manufacturing, mining, and the electric and gas industries. The individual series are constructed from two types of source data: (1) output measured in physical units and (2) data on inputs into the production process, in which output is inferred. Each component is given a weight based on how important it is to the economy. These weights are adjusted once a year. The current reference period for the index is 2002.
Durable goods manufacturing recorded a 0.4% gain in November. Manufacturing employment and hours worked suggested that U.S. factories have more orders to process. Manufacturing production was up 0.2% m/m and up 2.4% on a year-ago basis.
Motor vehicles and parts rose, 0.2% after three months of solid gains, (1.3% in October, 1.7% in September and 3.5% in August). This segment is now up 0.1% year on year, (y/y). However, tighter auto loan financing is starting to put a squeeze on top line sales.
Mining rebounded by 2.0% m/m after a 0.6% decline in October. Mining is up a healthy 9.4% y/y. Meanwhile utilities were down 1.9% m/m due to unseasonably warm weather. On a y/y utilities were up by 2.7%. Rising oil prices has brightened the outlook for this segment going forward.
Non-auto manufacturing production increased 0.2%. Production in this segment is 2.6% higher on a year-ago basis. Production of machinery which is essential to productivity gained a robust 0.7%.
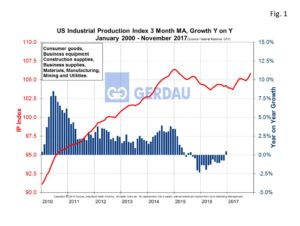 Figure 1 illustrates the U.S. industrial production from 2010 to present as a three month moving average, (3MMA) on the left hand Y axis. Year on year change in percent is shown on the right hand Y axis. The 3MMA in November was 105.82, up 0.6% m/m and up 1.6% year on year. Capacity utilization for total industry was up 0.1% m/m to 77.1%. Manufacturing capacity utilization scored a 76.4%, a gain of 0.1 percentage point m/m.
November’s industrial production report was very encouraging. The strong fundamentals are expected to continue to drive further gains in the months ahead. There are still a few hurricane related challenges but overall the U.S. economy is performing much better. A weaker dollar is helping manufactures market their products overseas and the global economy is in the best shape in years. A strong labor market should push wages higher which will support still stronger consumer spending and therefore higher demand for manufactured products.
We monitor US Industrial Production at Gerdau because it gives a real time evaluation of the current health and insight on the short-range future of the manufacturing sector.