

U.S. Industrial Production
Industrial production bounced back in September, up 0.3% month on month, (m/m), after taking a 0.9% dip in August. Production was broad based. Utilities and mining posted gains, which were unexpected due to the damage caused by the recent hurricanes. Manufacturing production disappointed however, up a weaker than expected 0.1% m/m. Manufacturing production was up 1% on a year-ago basis.
Industrial production is a pure measure of output, untainted by the effects of price swings, in the industrial part of the U.S. economy. Every month, the Federal Reserve calculates an index of industrial production after collecting data on 312 industry components representing manufacturing, mining, and the electric and gas industries. The individual series are constructed from two types of source data: (1) output measured in physical units and (2) data on inputs into the production process, in which output is inferred. Data from private trade associations and government agencies on physical products are used whenever possible. Each component is given a weight based on how important it is to the economy. These weights are adjusted once a year. The current reference period for the index is 2002.
Durable goods manufacturing recorded a 1.0% gain in August. The largest contributor was in high tech. Motor vehicles and parts had a strong August, (+3.6%) as cars and trucks damaged in the hurricanes were replaced. However, September’s motor vehicles and parts score was just 0.1%. This segment is now down 3.2% year on year, (y/y) and the future outlook portends slower sales as banks are curtailing their subprime lending practices.
Non-auto manufacturing production increased 0.3% and was higher by 1.9% y/y. Machinery production, was up 3.0% in September, its first increase in five months. Business equipment production rose 0.8% m/m and was higher by 2.1% y/y. Consumer goods production advanced 0.5% m/m and was up by 0.2% y/y. Utilities moved the needle the most rising 1.5% for September and posted an upward revision for August. Analysts had expected that damage and outages from the named storms would pull the numbers lower. On a year on year basis this volatile segment was up 4.1%.
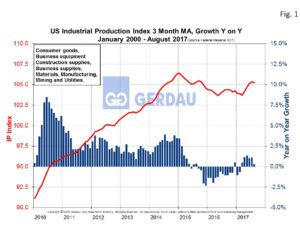 Figure 1 illustrates the US industrial production from 2010 to present as a three month moving average, (3MMA) on the left hand Y axis. Year on year change in percent is shown on the right hand Y axis. The 3MMA in September was 104.69, down 0.2% m/m and up 0.4% year on year. Capacity utilization for total industry was up 0.2 percentage point m/m at 76.0%. Manufacturing capacity utilization scored a 75.1%, flat m/m and down from its recent peak of 76.0% recorded in April.
Figure 2 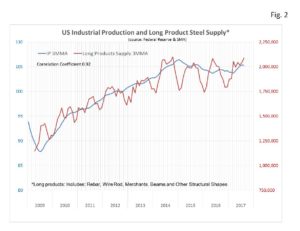 plots the 3MMA of the industrial production Index on the left Y axis and long product supply 3MMA on the right Y axis from 2009 to present. The correlation coefficient between these two data sets is a very strong at 0.92. Therefore a rising industrial production Index is an excellent predictor of long product steel demand.
September’s industrial production report was encouraging. The robust fundamentals are expected to support further gains in industrial production. The U.S. economy continues to perform well and the global economy is also in good shape. Stronger U.S. manufacturing demand is expected to increase production over the next several quarters. In addition oil drilling could move higher because of rising geopolitical tension.
We monitor US Industrial Production at Gerdau because it gives a real time evaluation of the current health and insight on the short-range future of the manufacturing sector.