

U.S. Industrial Production
After six consecutive monthly gains, the Industrial production declined 0.9% month on month, (m/m) in August. Early indications are that hurricane Harvey’s impact reduced the score by 0.75 percentage point. Manufacturing industries most effected by the wind and flooding damage include; petroleum refining, organic chemicals and plastics and resins. Mining output slowed by 0.8% in August as Harvey temporarily caused drilling, servicing and extraction activity for oil and gas to be curtailed. Unseasonably cool weather on the East Coast reduced demand for air conditioning causing utilities to fall 5.5%.
Industrial production is a pure measure of output, untainted by the effects of price swings, in the industrial part of the U.S. economy. Every month, the Federal Reserve calculates an index of industrial production after collecting data on 312 industry components representing manufacturing, mining, and the electric and gas industries. The individual series are constructed from two types of source data: (1) output measured in physical units and (2) data on inputs into the production process, in which output is inferred. Data from private trade associations and government agencies on physical products are used whenever possible. Each component is given a weight based on how important it is to the economy. These weights are adjusted once a year. The current reference period for the index is 2002.
Durable goods manufacturing managed a 0.3% gain in August. The largest contributor was in motor vehicles and parts. After a couple of slow months the non-auto slice of manufacturing managed a 2.2% m/m increase in output in August. Primary metals also performed well, climbing 1.0% for the month.
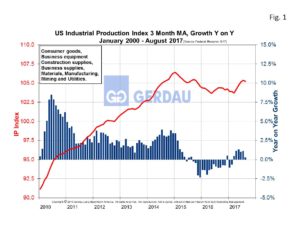 Figure 1 illustrates the US industrial production from 2010 to present as a three month moving average, (3MMA) on the left hand Y axis. Year on year change in percent is shown on the right hand Y axis. The 3MMA in August was 105.24, down 0.1% m/m and up 0.3% year on year. Capacity utilization for total industry was down 0.8 percentage point m/m at 76.1%. Overall manufacturing capacity utilization scored a 75.3%, off 0.3 percentage point m/m.
Figure 2 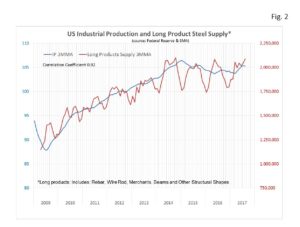 plots the 3MMA of the industrial production Index on the left Y axis and long product supply 3MMA on the right Y axis from 2009 to present. The correlation coefficient between these two data sets is a very strong at 0.92. Therefore a rising industrial production Index is an excellent predictor of long product steel demand and the good news is that the industrial production index is trending higher.
August’s industrial production report was encouraging. Manufacturing businesses remain upbeat on the future. Anticipation that businesses will see a significant income tax cut in the coming months is buoying spirits for a brighter future.
We monitor US Industrial Production at Gerdau because it gives a real time evaluation of the current health and insight on the short-range future of the manufacturing sector.