

U.S. Industrial Production
The IP index recorded a value of 105.47 in July, up 0.2% month on month (m/m) and by 0.9% year on year (y/y). July’s score was slightly lower than analysts’ consensus expectations. July was the sixth month in a row with either a flat or positive m/m gain. The increasing trend is welcome news for manufacturing.
Industrial production is a pure measure of output, untainted by the effects of price swings, in the industrial part of the U.S. economy. Every month, the Federal Reserve calculates an index of industrial production after collecting data on 312 industry components representing manufacturing, mining, and the electric and gas industries. The individual series are constructed from two types of source data: (1) output measured in physical units and (2) data on inputs into the production process, in which output is inferred. Data from private trade associations and government agencies on physical products are used whenever possible. Each component is given a weight based on how important it is to the economy. These weights are adjusted once a year. The current reference period for the index is 2002.
Manufacturing output was down a tick (0.1%), in July, it was up 0.2% in June, down 0.6% in May and up 1.1% in April. On a y/y basis, manufacturing production was up 2.2% y/y. Motor vehicle and parts production dropped a significant 3.6%, and last month’s number was revised downward from -0.7% to -0.8%. This segment has now been in decline for three consecutive months and is lower by 5.0% y/y. The automotive sector looks to be in for a rough-ride over the next few quarters as sub-prime lenders are tightening loan standards.
The non-auto slice of manufacturing managed a 0.2% m/m increase in output and was higher by 1.7% y/y. This sector has posted m/m gains in five of the past seven months.
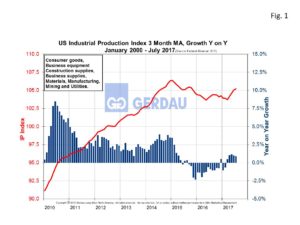 Figure 1 illustrates the US industrial production from 2010 to present as a three month moving average, (3MMA) on the left hand Y axis. Year on year change in percent is shown on the right hand Y axis. The 3MMA in July was 105.22, up 0.2% month on month and up 1.0% year on year. Capacity utilization for the industrial sector was flat m/m at 76.7%.
Production gains in the mining sector of 0.5% m/m and in six of the past seven months have helped offset declines in the automotive sector. Lower break-even point on well production through technological improvements was a key contributor. Oil and gas production is fast approaching early 2015 levels and the increased in the number of active rigs is creating demand for steel products.
July’s IP report was encouraging. Manufacturing businesses remain upbeat on the future. Favorable domestic and global fundamentals are helping U.S. industrial production to trend higher. It is probable that manufacturing will continue to post production and capacity utilization advances in the coming months. US oil producers have ramped up production since the price has surpassed the break-even point. Higher prices will bring-on more new wells and support additional steel sales.
We monitor US Industrial Production at Gerdau because it gives a real time evaluation of the current health and insight on the short-range future of the manufacturing sector.