

U.S. Industrial Production
The IP index on a three month moving average (3MMA), basis ticked up 0.4% month on month (m/m), beating analysts’ expectations of 0.3% growth. Industrial production advanced at an annual rate of 4.7% the Q2 as mining (includes oil exploration) and utilities were the principal contributors. Manufacturing output rose at an annual rate of 1.4%, down a fraction from Q1. The index started off 2017 with two down months but has now staged four months in a row of positive growth. Capacity utilization edged-up 0.2 point month on month (m/m), in June to 76.6%, but remains 3.3 percentage points below its long-run (1972–2016) average.
Consumer durables recorded a gain of 1.0% in June primarily as a function of automotive products, appliances, furniture, and carpeting. The index construction supplies was unchanged in June. The output of energy materials increased 1%.
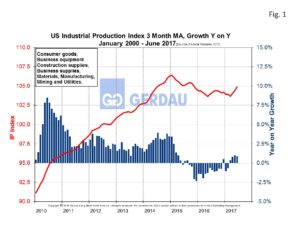 Figure 1 shows the three month moving average (3MMA), of the US IP index from 2010 to present. The IP index has a string of negative growth from mid-2015 until February 2017. Since then the IP index has recorded four consecutive m/m increases.
June’s IP report was encouraging and the outlook going forward looks good as well. The U.S. Energy Administration (EIA), forecasts Industrial Production to increase by 2.2% in 2017 and by 2.8% in 2018. Manufacturing, the largest component of IP, expected to advance by 2.0% in 2017 and 2.5% in 2018.
At Gerdau, we monitor the US IP index since it gives a broad overview of the health the of the US economy. Drilling down into the sub-indexes of manufacturing, energy, mining and construction offers a current view of “where we are at” relative to demand for steel long products along with a window into the likely trends going forward.