

U.S. Industrial Production
The February Industrial production, (IP) report was better than analyst’s expectation, gaining 1.1% month on month, (m/m). This after a disappointing negative 0.3% change in January. On a three month moving average, (3MMA) of IP moved-up 0.4% m/m. On a year on year, (y/y) basis, the IP index was up 4.4%. Overall capacity utilization rose 0.7 percentage point, while manufacturing capacity utilization rose 0.9 percentage point. Prospects for continued growth in 2018 look promising indeed as companies will see a 14% decline in the corporate tax rate. An additional major benefit is the allowance to expense the costs of equipment immediately. This will result in more capital investment for manufacturing and construction equipment.
Industrial production is a pure measure of output, untainted by the effects of price swings, in the industrial part of the U.S. economy. Every month, the Federal Reserve calculates an index of industrial production after collecting data on 312 industry components representing manufacturing, mining, and the electric and gas industries. The individual series are constructed from two types of source data: (1) output measured in physical units and (2) data on inputs into the production process, in which output is inferred. Each component is given a weight based on how important it is to the economy. These weights are adjusted once a year. The current reference period for the index is 2002.
Durable goods surged a 1.8% in February, a sharp rebound from a loss of 0.4 percentage point in January.
Motor vehicle and parts jumped 3.9% February. This rebound comes on the heels of a -0.2 percentage point decline in January. Strong demand is supporting auto sales despite tougher loan standards. Non-auto manufacturing production increased 1.0% m/m and is higher by 2.5% on a y/y comparison.
Utilities pulled back 4.7% m/m in February after a run of very cold weather earlier in the year. On a y/y basis utilities production was up 10.5%.
Mining production gained by 4.3% m/m and was higher by 9.7% y/y. Rising energy prices has brightened the outlook for this segment going forward driving the rig count higher as oil producers increase production. U.S. crude oil output reached a record high of 10.7 million barrels per day last month, surpassing production output going all the way back to the 1970s.
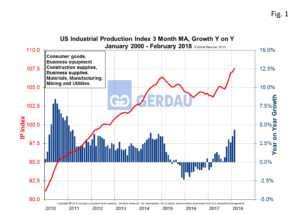 Figure 1 illustrates the U.S. industrial production from 2010 to present as a three month moving average, (3MMA) on the left hand Y axis. Year on year change in percent is shown on the right hand Y axis. The 3MMA in February was 107.55, up 0.4% m/m and up 4.4% year on year.
The economy continues to be strong both domestically and globally. Supporting this argument is the utilization of transportation equipment which recorded its highest capacity utilization rate in 20 years. Concerns on the horizon are labor constraints and rising wage pressures.
We monitor U.S. Industrial Production at Gerdau because it gives a real time evaluation of the current health and insight on the short-range future of the manufacturing sector.