

U.S. Industrial Production
The December Industrial production, (IP) increase was revised downward from +0.9% to +0.4%. The monthly percentage change in January was -0.1%, however, the three month moving average, (3MMA) of IP moved-up 0.3% in January. On a year on year, (y/y) basis, the IP index was up 2.8%. Headed into 2018, companies will benefit from a 14% drop in the corporate tax rate. In addition they will be allowed to expense the costs of equipment immediately, driving more capital investments for manufacturing and construction equipment.
Industrial production is a pure measure of output, untainted by the effects of price swings, in the industrial part of the U.S. economy. Every month, the Federal Reserve calculates an index of industrial production after collecting data on 312 industry components representing manufacturing, mining, and the electric and gas industries. The individual series are constructed from two types of source data: (1) output measured in physical units and (2) data on inputs into the production process, in which output is inferred. Each component is given a weight based on how important it is to the economy. These weights are adjusted once a year. The current reference period for the index is 2002.
Durable goods manufacturing recorded a 0.2% gain in January. Motor vehicle and parts were unchanged in January. However, auto sales lost ground and are now 1.6% lower than at this same point last year. Non-automotive manufacturing production fell 0.1% month on month, (m/m). The good news is that it was stronger by 3.8% on a y/y basis.
Utilities rose a strong 0.6% in January and was higher by 10.8% y/y as cold weather in several areas of the country helped top-line sales.
Mining production declined by 1.0% m/m, but posted an 8.8% y/y gain. Rising energy prices has brightened the outlook for this segment going forward driving the rig count higher as oil producers increase production. Price gains are anticipated to be limited as OPEC’s actions make an impact.
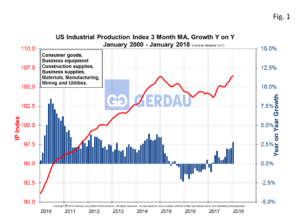 Figure 1 illustrates the U.S. industrial production from 2010 to present as a three month moving average, (3MMA) on the left hand Y axis. Year on year change in percent is shown on the right hand Y axis. The 3MMA in January was 106.44, up 0.3% m/m and up 2.8% year on year. Capacity utilization for total industry was down 0.2% m/m to 77.5%. Manufacturing utilization was flat at 76.2%.
Despite the slight decline in January, economic trends remain favorable and the economy is strong. Prospects for the balance of the year look promising, supported by the new tax policy and a weakening U.S. dollar. Overall capacity utilization is moving steadily higher, as demand is strong both domestically and globally. A strong labor market is sending wages higher which will support still stronger consumer spending and therefore higher demand for manufactured products.
We monitor U.S. Industrial Production at Gerdau because it gives a real time evaluation of the current health and insight on the short-range future of the manufacturing sector.