

U.S. Industrial Production
The IP index recorded a value of 105.10 in April, up 1.0% month on month (m/m) and by 1.2% year on year (y/y). April’s score exceeded analysts’ expectations and was the third month in a row with a positive m/m gain. The increasing trend is welcome news for manufacturing.
Industrial production is a pure measure of output, untainted by the effects of price swings, in the industrial part of the U.S. economy. Every month, the Federal Reserve calculates an index of industrial production after collecting data on 312 industry components representing manufacturing, mining, and the electric and gas industries. The individual series are constructed from two types of source data: (1) output measured in physical units and (2) data on inputs into the production process, in which output is inferred. Data from private trade associations and government agencies on physical products are used whenever possible. Each component is given a weight based on how important it is to the economy. These weights are adjusted once a year. The current reference period for the index is 2002.
Manufacturing output was up 1.0% in April after being down 0.4% in April. Manufacturing production is now up 1.7% y/y. Motor vehicle and parts production was up 5.0%, although last month’s -3.0% number was revised downward to -3.6%. This segment is currently undergoing considerable volatility, however was up 1.7% on a y/y basis. The non-auto slice of manufacturing managed a 0.7% m/m increase in output. This sector has posted m/m gains in six of the past seven months.
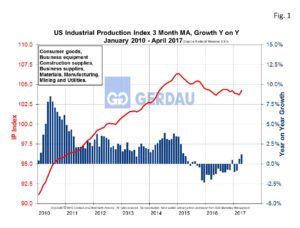 Figure 1 illustrates the US industrial production from 2010 to present as a three month moving average, (3MMA) on the left hand Y axis. Year on year change in percent is shown on the right hand Y axis. The 3MMA in April was 104.24, up 0.5% month on month and up 0.3% year on year.
Capacity utilization for the industrial sector increased 0.6 of a point in April to 76.7%. The specific sub-category capacity utilization figure for manufacturing was register a 75.9% in April, up 0.7 points m/m. Manufacturing capacity utilization is slowly increasing rising 0.9 points over the past six months.
April’s IP report was encouraging. It portends that manufacturing will continue to post production and capacity utilization advances in the coming months. US oil producers have ramped up production since the price has surpassed the break-even point. Higher prices will bring-on more new wells and support additional gains. US auto sales appear to have peaked yet sales remain at elevated levels as US producers are hopeful that robust global demand will absorb the slack.