U.S. Housing Starts and Permits
According to the U.S. Census Bureau’s latest data, housing starts fell by 7.0% month on month, (m/m) in February to a seasonally adjusted annualized rate (SAAR) of 1,236,000 units. This figure was down 90,000 from January’s SAAR of 1,326,000 units. On a year on year, (y/y) basis, starts were exactly flat at 1,236,000. On a regional comparison, starts decreased in three of the four Census regions. However, permits were higher in three of the four Census regions indicating a stronger build rate on a go forward basis.
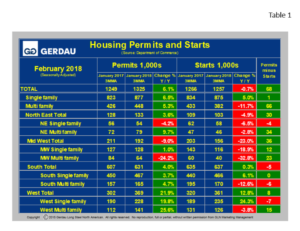
 Table 1 breaks down starts and permit detail for single family, (SF) and multi-family, (MF) by region. All data references are three month moving averages y/y, (3MMA y/y), which helps smooth out spikes in single month data and therefore gives a more realistic viewpoint on the pulse of home building activity.
On this 3MMA basis, nationally, SAAR, total starts were 1,266,000, lower by 0.7% y/y. Nationally SF increased by 5.0%, while MF declined by 11.7%. Regionally building starts varied quite significantly. The West’s starts were very strong, up 12.8% breaking down to +24.3% for SF and -3.8% for MF. The Northeast reported a 4.9% y/y decline in starts, a combination of a -6.5% for SF and of -2.8% y/y for MF. The South posted overall starts growth of +0.3% comprising of SF +6.1% and MF -12.6%. The Midwest total starts plummeted -23.0% y/y, with SF -18.9% and MF -32.8%.
Regionally, SAAR, 3MMA SF permits fell 4.2% in the Northeast and were higher by 1.0% in the Mid-West. The South posted a 3.7% rise in SF permits, while the West’s SF swelled by 19.8%.
Nationally, SAAR, 3MMA, MF permits increased by 5.3%. Multi-family permits were higher in three of the four regions. MF Permits were down 24.2% in the Mid-West. The West, recorded the strongest growth, up 25.6%, while the Northeast MF permits were up 9.7% y/y and the South MF permits were higher by 4.7%.
Permits gage future housing builds. The column on the far right in Table1 illustrates permits minus starts. For the nation as a whole permits minus starts = +68,000. This indicates that housing construction should rise in the coming months.
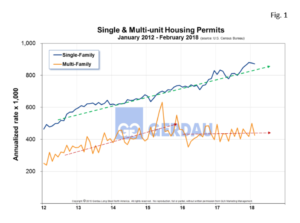
Figure 1 shows SA housing permits history from 2012 to present. Single family is growing at a steady rate. Recently multi-family starts have plateaued. Relative to history, multi-family starts are higher than during the pre-recession time-period. Limited supply is pushing house price growth higher. Gains are widespread, with all regions improving on a year ago-basis.
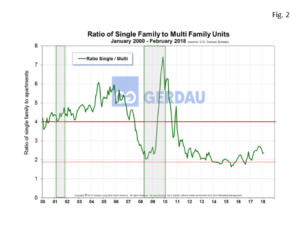
 Figure 2 illustrates the ratio of SF to MF from 2000 to present. Pre-recession the ratio of SF:MF was in the 5:1 to 6:1 range. This ratio plummeted after the recession as demand shifted towards apartments. The ratio fell below 2:1 throughout most of 2014 and 2015 and is now trending higher. The 3MMA was 2.36:1 in February. The ratio has been trending higher over the past year. This shift means that consumers have gained sufficient confidence in the strength of the economy to step-up and purchase a SF house.
The construction industry is still expanding and construction employment continues to rise at a good clip. Overall, the housing market is well positioned for continued growth. Price gains will likely continue, although prices are expected to rise at a slower pace in the coming quarters.
At Gerdau, we routinely monitor the U.S. housing market because historically new home construction has preceded non-residential construction and therefore is an excellent barometer to foresee the likely future demand for construction steel products.

