

U.S. Housing Starts and Permits
According to the U.S. Census Bureau’s latest data, housing starts fell 8.2% month on month, (m/m) in December to a seasonally adjusted annualized rate (SAAR) of 1,192,000 units. This was lower than the revised November estimate of 1,299,000 units. On a year on year, (y/y) basis, starts declined by 6.0%.
Cold and heavy snowfall were factors impacting December completions in the Northeast and Midwest. In addition it was reported that housing starts could not keep up the pace in December given that most construction companies are operating at close to full capacity. It is probable that the next few months will see higher completions, however a shortage of some specialty contractors is causing some capacity constraints that will take some time to sort-out.
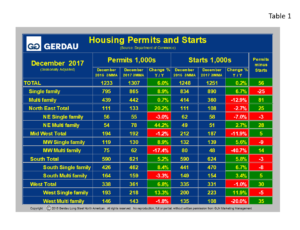 Table 1 breaks down starts and permit detail for single family, (SF) and multi-family, (MF) by region. All data references are three month moving averages y/y, (3MMA y/y), which helps smooth out spikes in single month data and therefore gives a more realistic viewpoint on the pulse of home building activity. On this 3MMA basis, nationally, SAAR, total starts were higher by 0.2% y/y. Regionally SF starts fell by 7.0% in the Northeast, but were higher in each of the other zones. The West saw SF starts jump 11.9%, the South +6.7% and the Midwest +5.6%.
Nationally, SAAR, 3MMA, MF starts fell by 12.9%. Multi-family starts were lower y/y in two of the four regions led lower by a 40.7% plunge in the Midwest, and a 20.0% decline in the West. The South recorded MF starts higher by 3.4%, while MF starts in the Northeast were up by 2.7% y/y.
Nationally, total SAAR, 3MMA, permits increased by 6.0%, y/y to 1,307,000 units with SF permits up 8.9% and MF permits up 0.7%. Regionally building permits varied quite significantly. The West’s permits were higher by 6.8% breaking down to +13.3% for SF and -1.8% for MF. The Northeast reported a 20.2% y/y rise in permits, a combination of a 3.0% y/y decrease for SF and a surge of 44.2% y/y for MF. The Midwest total permits were down 1.2% y/y, with SF +8.9% and MF -17.4%. The South posted overall permit growth of +5.2% comprising of SF +8.4% and MF -3.3%.
Permits gage future housing builds. The column on the far right in Table1 illustrates permits minus starts. For the nation as a whole permits minus starts = +56,000. This indicates that housing construction should rise in the coming months.
Figure 1 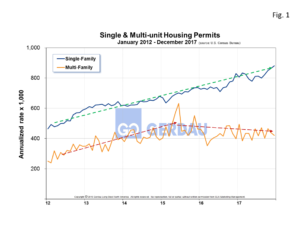 shows SA housing permits history from 2012 to present. Single family is growing at a steady rate. Recently multi-family starts have plateaued. Relative to history, multi-family starts are higher than during the pre-recession time-period.
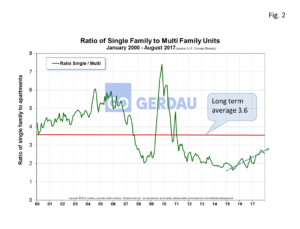 Figure 2 illustrates the ratio of SF to MF from 2000 to present. Pre-recession the ratio of SF:MF was in the 5:1 to 6:1 range. This ratio plummeted after the recession as demand shifted towards apartments. The ratio fell below 2:1 throughout most of 2014 and 2015 and is now trending higher. The 3MMA was 2.6:1 in December. The ratio has been trending steadily higher over the past year. This shift means that consumers have gained sufficient confidence in the strength of the economy to step-up and purchase a SF house. In addition to a higher consumer confidence level, the National Association of Home Builders, (NAHB) reported a score of 72, (>50 indicates a favorable outlook) on its Housing Market Index, up 5 points from January 2017. The sub-index was the strongest in the West at 83, followed by a score of 72 in the South, a 69 in the Midwest and a 62 in the Northeast. The NAHB expects the new home market to continue to strengthen at a modest rate for the foreseeable future.
At Gerdau, we routinely monitor the US housing market because historically new home construction has preceded non-residential construction and therefore is an excellent barometer to foresee the likely future demand for construction steel products.