U.S. Housing Starts and Permits
Total housing starts were reported at a seasonally adjusted (SA), annual rate of 1,221,000 for the month of April. On a three month moving average (3MMA), basis SA starts were 1,160,000, a 5.2% year on year growth rate. Single family housing starts moved-up 7.8%, 3MMA y/y, while multi-family were flat, -0.2%, 3MMA y/y, over the same timeframe comparison.
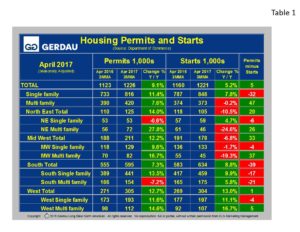
 Table 1 breaks down starts and permit detail for single family (SF) and multi-family (MF) by region. All data references are three month moving averages y/y, (3MMA y/y), which helps smooth out spikes in single month data and therefore gives a more realistic viewpoint on the pulse of home building activity. Year on year SF starts in April were a mixed bag, up in the South, (9.9%), West (11.1%), and Northeast (4.7%), but down in the Midwest, off 1.7%. Year on year MF starts plummeted 24.6% in the Northeast and by 19.3% in the Midwest, but were up in the South (5.8%) and West (16.7%).
Nationally, permits increased 9.1% 3MMA y/y to 1,226,000 units with SF up 11.4% and MF up 7.6%. All regions reports stronger growth in building permits y/y. The Northeast reported a 14.0% y/y rise in permits, a combination of a slight -0.6% decline for SF and a large 27.8% y/y gain for MF. The Midwest reported a 12.2% increase in permits (SF +9.6%, MF +16.7%), while the South posted overall permit growth of 7.3%, (SF +13.5%, MF -7.2%). The West saw its residential permits increase by 12.7%, (SF +11.6% y/y, MF 14.6%).
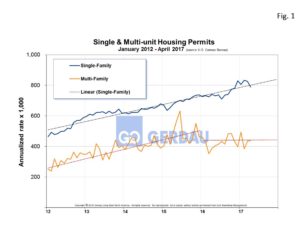
 Figure 1 shows permit history for both SF and MF from 2012 to present. The slope of the SF line shows relatively consistent growth over the time horizon presented as depicted by the “best fit” linear line. The multi-family line albeit more volatile that SF had the same growth trajectory as SF through the end of 2016. Since then the rate of growth has plateaued at about a 440,000 annualized rate.
Permits lead starts and thus are a great yardstick to gage future housing builds. If permits are lower than starts, it indicates that the market is softening and vice versa when permits exceed starts. The column on the far right in Table1 illustrates permits minus starts. For the nation as a whole permits minus starts = +5,000, with SF negative 32,000 but with MF offsetting this with positive 47,000 units. This indicates that future housing construction is on the rise.
With the economy at near full employment, demand for housing is expected to pick-up. Credit quality remains good and demand continues to drive prices higher. The downside risks are monetary and trade policy, which are largely unclear at the present time. A low ratio of first time homebuyers is resulting in a slower than normal rebound in new home construction. According to National Association of Realtors survey, first-time homebuyers make about a third of the market. This ratio would need to rise to 40% to see a significant rise in construction activity. Strong rental demand and high rents contribute to the challenge of saving sufficient funds to achieve a conventional down-payment, thereby elongating the slow housing market recovery.
At Gerdau, we routinely monitor the US housing market because historically new home construction has preceded non-residential construction and therefore is an excellent barometer to foresee the likely future demand for construction steel products.

