U.S. Housing Starts and Permits
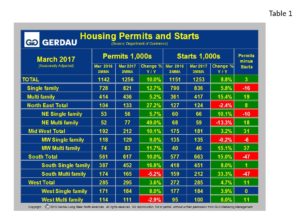
Total seasonally adjusted (SA), housing starts were reported at a seasonally adjusted annual rate of 1,253,000 for the month of March, on a 3MMA basis, up 8.8% year on year (y/y). Single family housing starts moved-up 5.8%, 3MMA y/y, while multi-family surged ahead by 15.4%, 3MMA y/y, over the same time comparison.
 Table 1 breaks down starts and permit detail for single family (SF) and multi-family (MF) by region. All data references are three month moving averages y/y (3MMA y/y), which helps smooth out spikes in single month data and therefore gives a more realistic viewpoint on the pulse of home building activity. All regions witnessed an increase in SF starts in March. The largest percentage change was in the Northeast with an increase of 10.1% to 66,000 units. The region recording the slowest y/y growth for SF was the Midwest which started 135,000 houses, a -0.2% change from March 2016. The South started 451,000 for an increase of 8.0% y/y, while the West recorded 184,000 starts for a 3.9% y/y increase. Multi-family (MF), starts varied considerably by region. The US as a nation saw MF starts increase by a solid 15.4% y/y. The South recorded very strong growth of +33.3% y/y, the Midwest also reported strong numbers, up 15.4%. Conversely MF starts in the Northeast declined by 13.3% y/y.
Nationally, permits increased 10.0% 3MMA y/y to 1,256,000 units with SF up 12.7% and MF up 5.2%. All regions reports stronger growth in building permits y/y. The Northeast reported a 27.2% y/y rise in permits, a combination of 5.7% SF and a huge 49.0% y/y gain for MF. The Midwest reported a 10.1% increase in permits (SF +9.0%, MF +11.7%), while the South posted overall permit growth of 10.0% (SF +16.8%, MF -5.2%). The West saw its permit increase by 3.6% (SF +8.0% y/y, MF -2.9%).
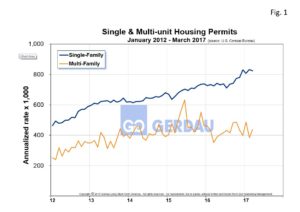
 Figure 1 shows permit history for both SF and MF from 2012 to present. The slope of the SF line exhibits a steeper growth curve since mid-2016, while the MF slope has plateaued. Permits lead starts and thus are a great yardstick to gage future housing builds. If permits are lower than starts, it indicates that the market is softening and vice versa when permits exceed starts. The column on the far right in Table 1 illustrates permits minus starts. For the nation as a whole permits minus starts = +3,000, with SF negative 16,000 but with MF offsetting this with positive 19,000 units. This indicates that future housing construction is on the rise. The March’s housing report was largely good news.
At Gerdau, we routinely monitor the US housing market because historically new home construction has preceded non-residential construction and therefore is an excellent barometer to foresee the likely future demand for construction steel products.

