U.S. Housing Starts and Permits
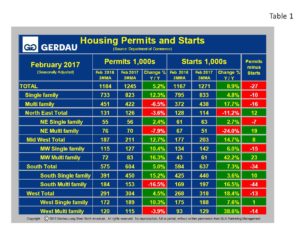
Total housing starts were reported at a seasonally adjusted annual rate of 1,167,000 for the month of February, on a 3MMA basis, up 8.9% year on year (y/y). Single family housing starts moved-up 4.8%, 3MMA y/y, while multi-family surged 17.7%, 3MMA y/y, over the same time comparison.
 Table 1 breaks down starts and permit detail for single family (SF) and multi-family (MF) by region. All regions witnessed an increase in SF starts in February. The largest percentage change was in the West with an increase of 7.6% to 188,000 units. The region recording the slowest y/y growth for SF was the Northeast which started 63,000 houses, a 2.7% change from February 2016. The South started 440,000 for an increase of 3.6% y/y, while the Midwest recorded 142,000 starts for a 6.0% y/y increase. Multi-family starts varied considerably by region. Midwest MF starts ballooned by 42.2% y/y, the West also posted huge growth with +38.6% y/y. Conversely MF start in the Northeast plummeted by 24.0% y/y.
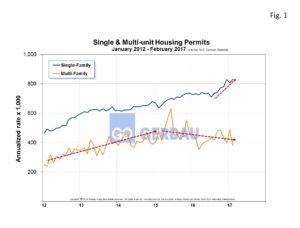
Looking at the total line, permits increased 5.2% y/y to 1,245,000 with SF up 12.3% and MF down 6.5%. Figure 1 shows permit history for both SF and MF from 2012 to present. The slope of the SF line exhibits a steeper growth curve since mid-2016, while the MF slope has been decelerating for nearly two years. After the recession MF took-off at a much greater rate than did SF as buyers stayed on the sidelines stung by the steep fall in property values. One of the results of this was a surge in demand for apartments. The MF line’s slope change indicates that we may be getting close to the saturation point.
Permits lead starts and thus are a great yardstick to gage future housing builds. If permits are lower than starts, it indicates that the market is softening and vice versa when permits exceed starts. The column on the far right in Table1 illustrates permits minus starts. Overall the build rate has softened slightly as evidenced by the red background / white font value of -27 on the total line. Scanning down this column we see some variation, however the variance between permits and starts are not very big. The exception is MF in the South, permits were down 16.5% y/y and the delta between permits and starts was 44,000.
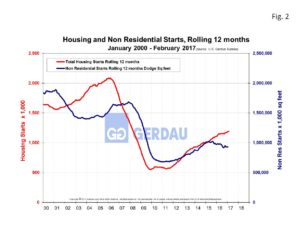
 Figure 2 compares housing starts with non-residential starts data. Historically housing starts have led non-residential starts. Non-residential starts (NRS) stalled in mid-2016 at close to one million square feet and have yet to turn-upwards according to data from Dodge Analytics. Rising housing starts should pull-up NRS going forward.
At Gerdau, we routinely monitor the US housing market because historically new home construction has preceded non-residential construction and therefore is an excellent barometer to foresee the likely future demand for construction steel products.

